Overview:
The current version of Cellinker 2.0 has documents over 7400 human and 5800 mouse protein ligand-receptor (L-R) interactions from literatures and other 15 resources. Cellinker 2.0 also including more than 790 human and 670 mouse metabolite L-R interactions. Additionally, the database has compiled information on over 1,900 enzymes and 260 transporters associated with these metabolites. In addition to its existing webserver for analyzing intercellular communication based on protein L-R interactions, Cellinker 2.0 introduces a new webserver dedicated to the analysis of the metabolite L-R interaction based intercellular communication.
The homepage is displayed in the following Fig 1-1.
1. Main functions of the platform are provided in menu bar form (boxed in red).
2. Introduction and overview for Cellinker 2.0.
3. Quick search for users.
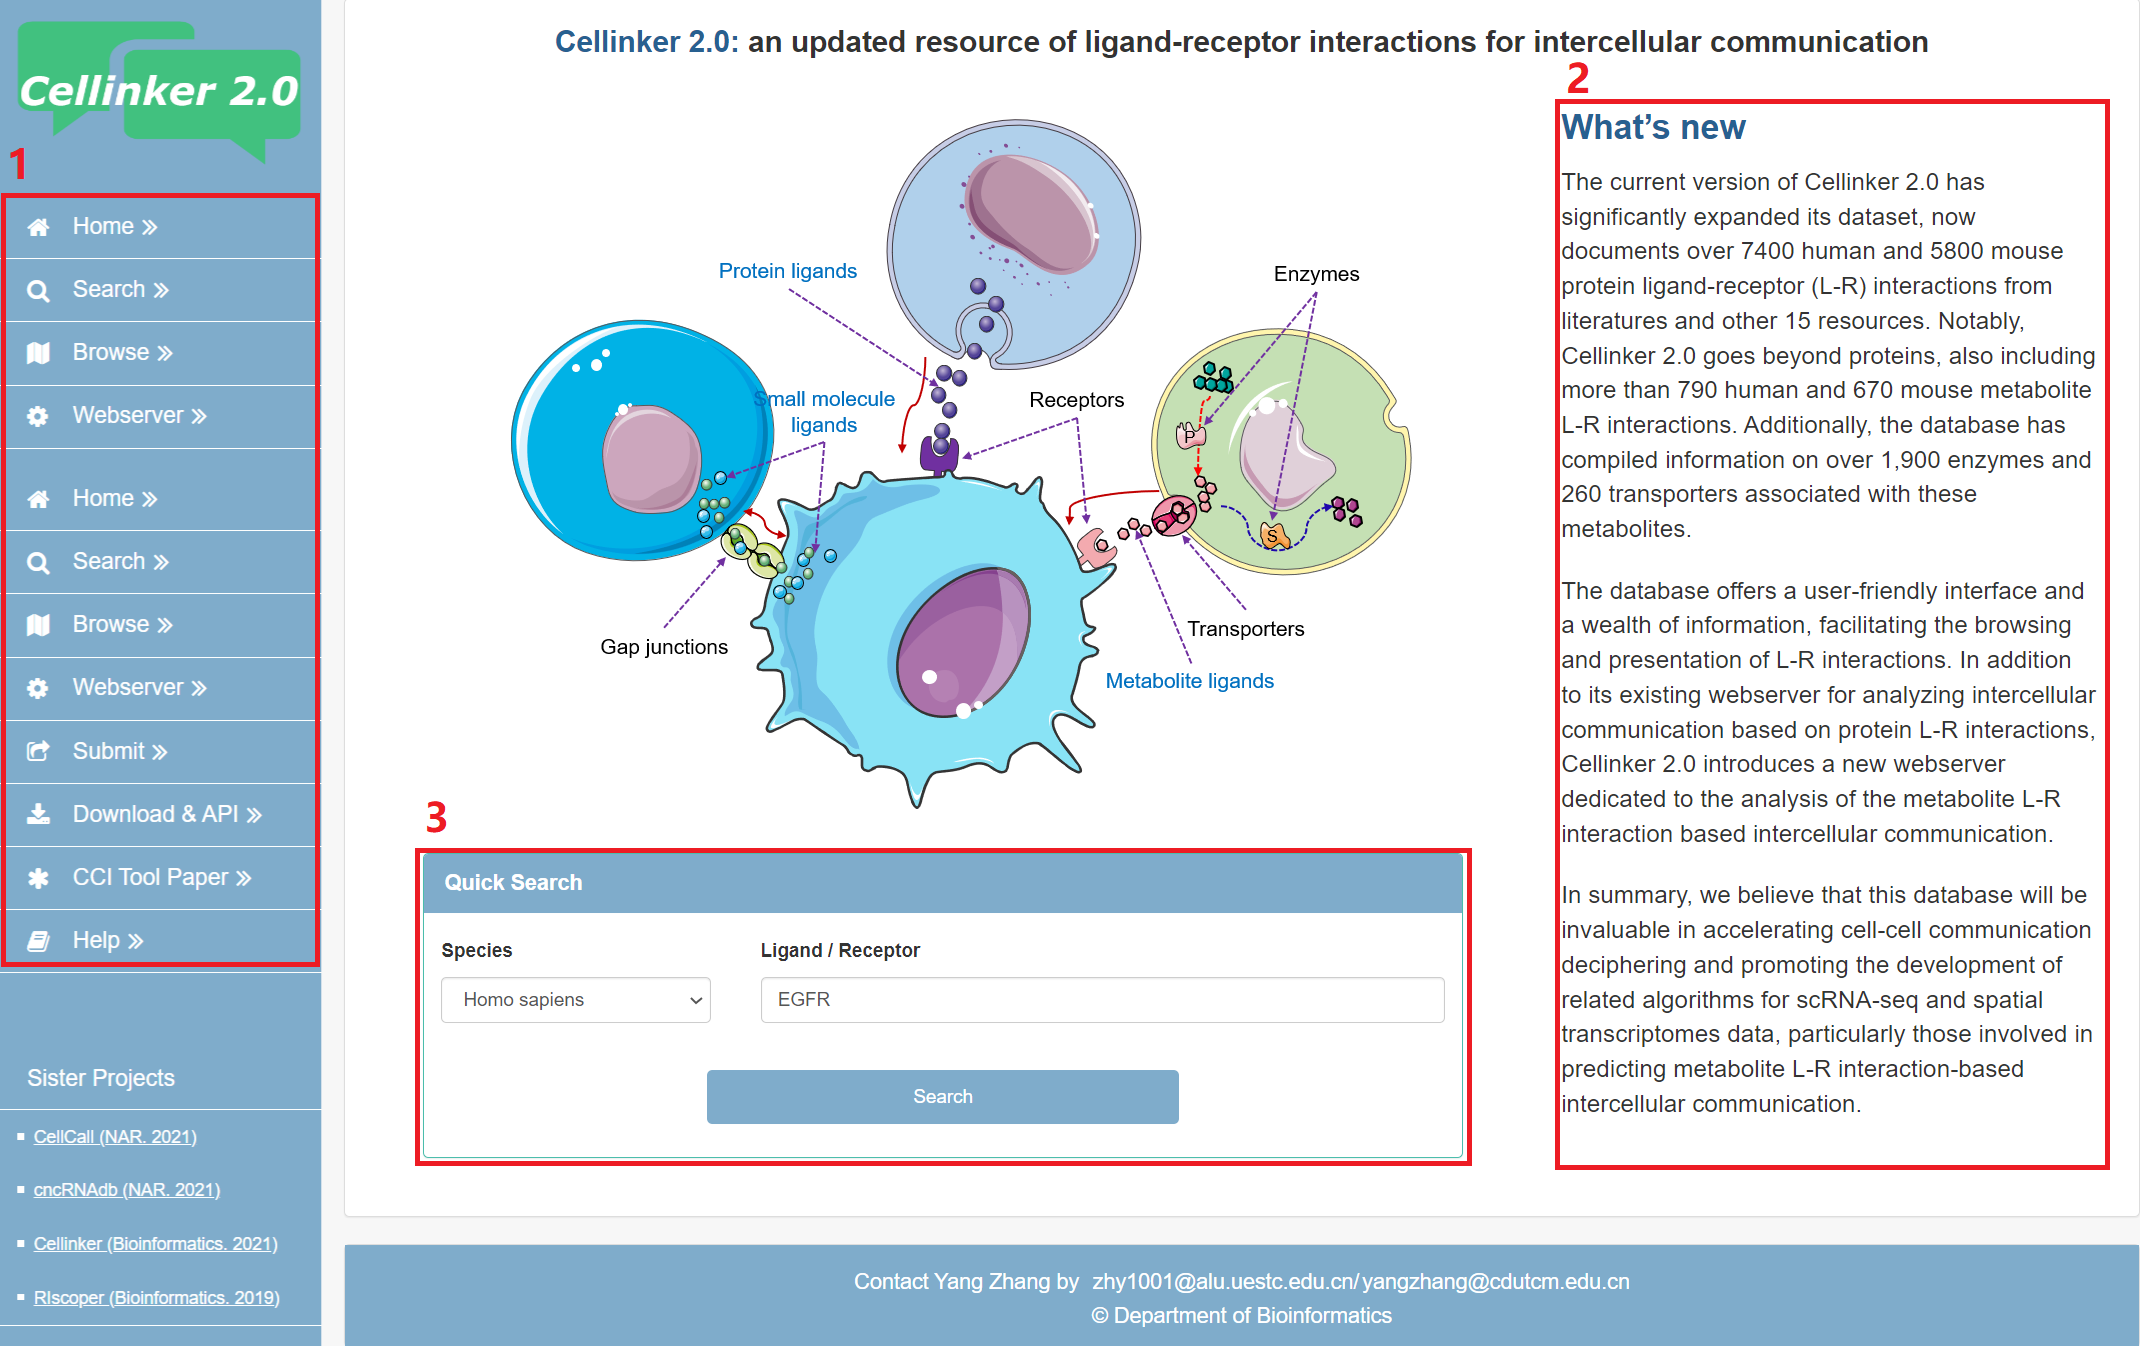
Fig 1-1. Home page
The search page is displayed in Fig 2-1 and Fig 2-2:
Fig 2-1 Search page of protein L-R interaction:
Exact search:
1. Select to search page of protein L-R interaction.
2. Carefully select a dataset: Three choices are provided (Gene Symbol/Entrez ID/Uniprot ID).
3. Input a keyword corresponding to selected dataset.
4. Select the species to filter the search (Homo sapiens or Mus musculus).
Batch search:
5. Input or upload Gene Symbol/Entrez ID/Metabolite list of ligands/receptors to query corresponding interesting interactions.
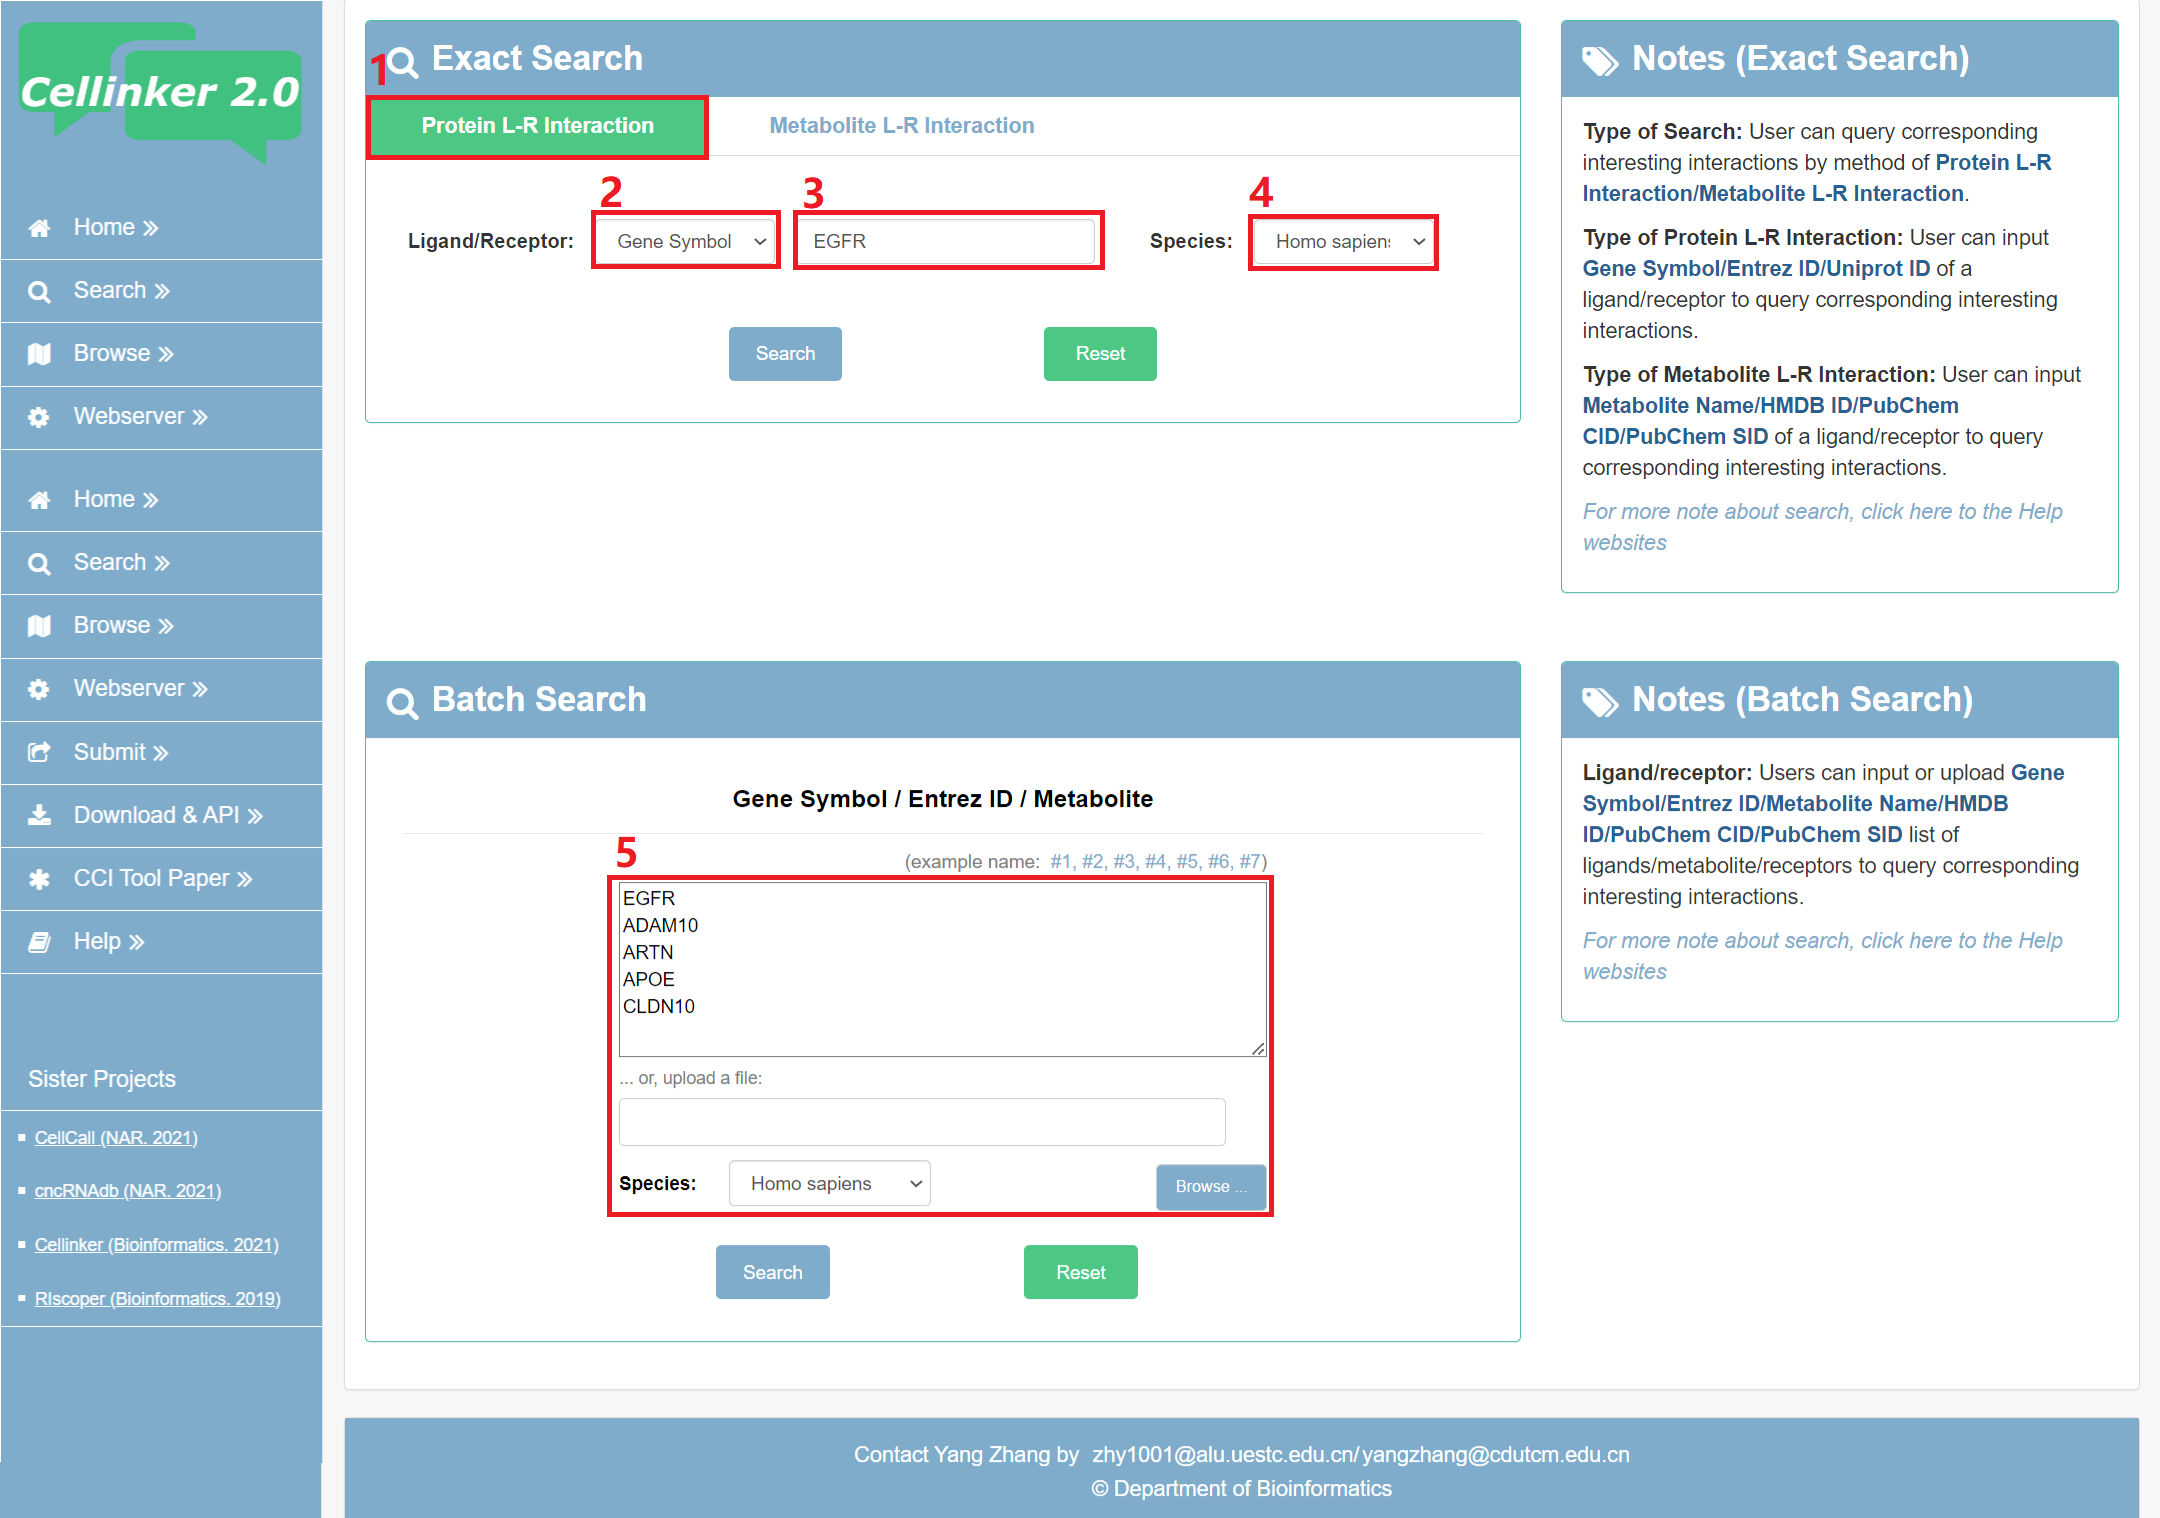
Fig 2-1. Search page of protein L-R interaction
Fig 2-2 Search page of metabolite L-R interaction:
Exact search:
1. Select to search page of metabolite L-R interaction.
2. Carefully select a dataset: Four choices are provided (Metabolite name/HMDB ID/PubChem CID/SID).
3. Input a keyword corresponding to selected dataset.
4. Select the species to filter the search (Homo sapiens or Mus musculus).
Batch search:
5. Input or upload Gene Symbol/Entrez ID/Metabolite list of ligands/receptors to query corresponding interesting interactions.
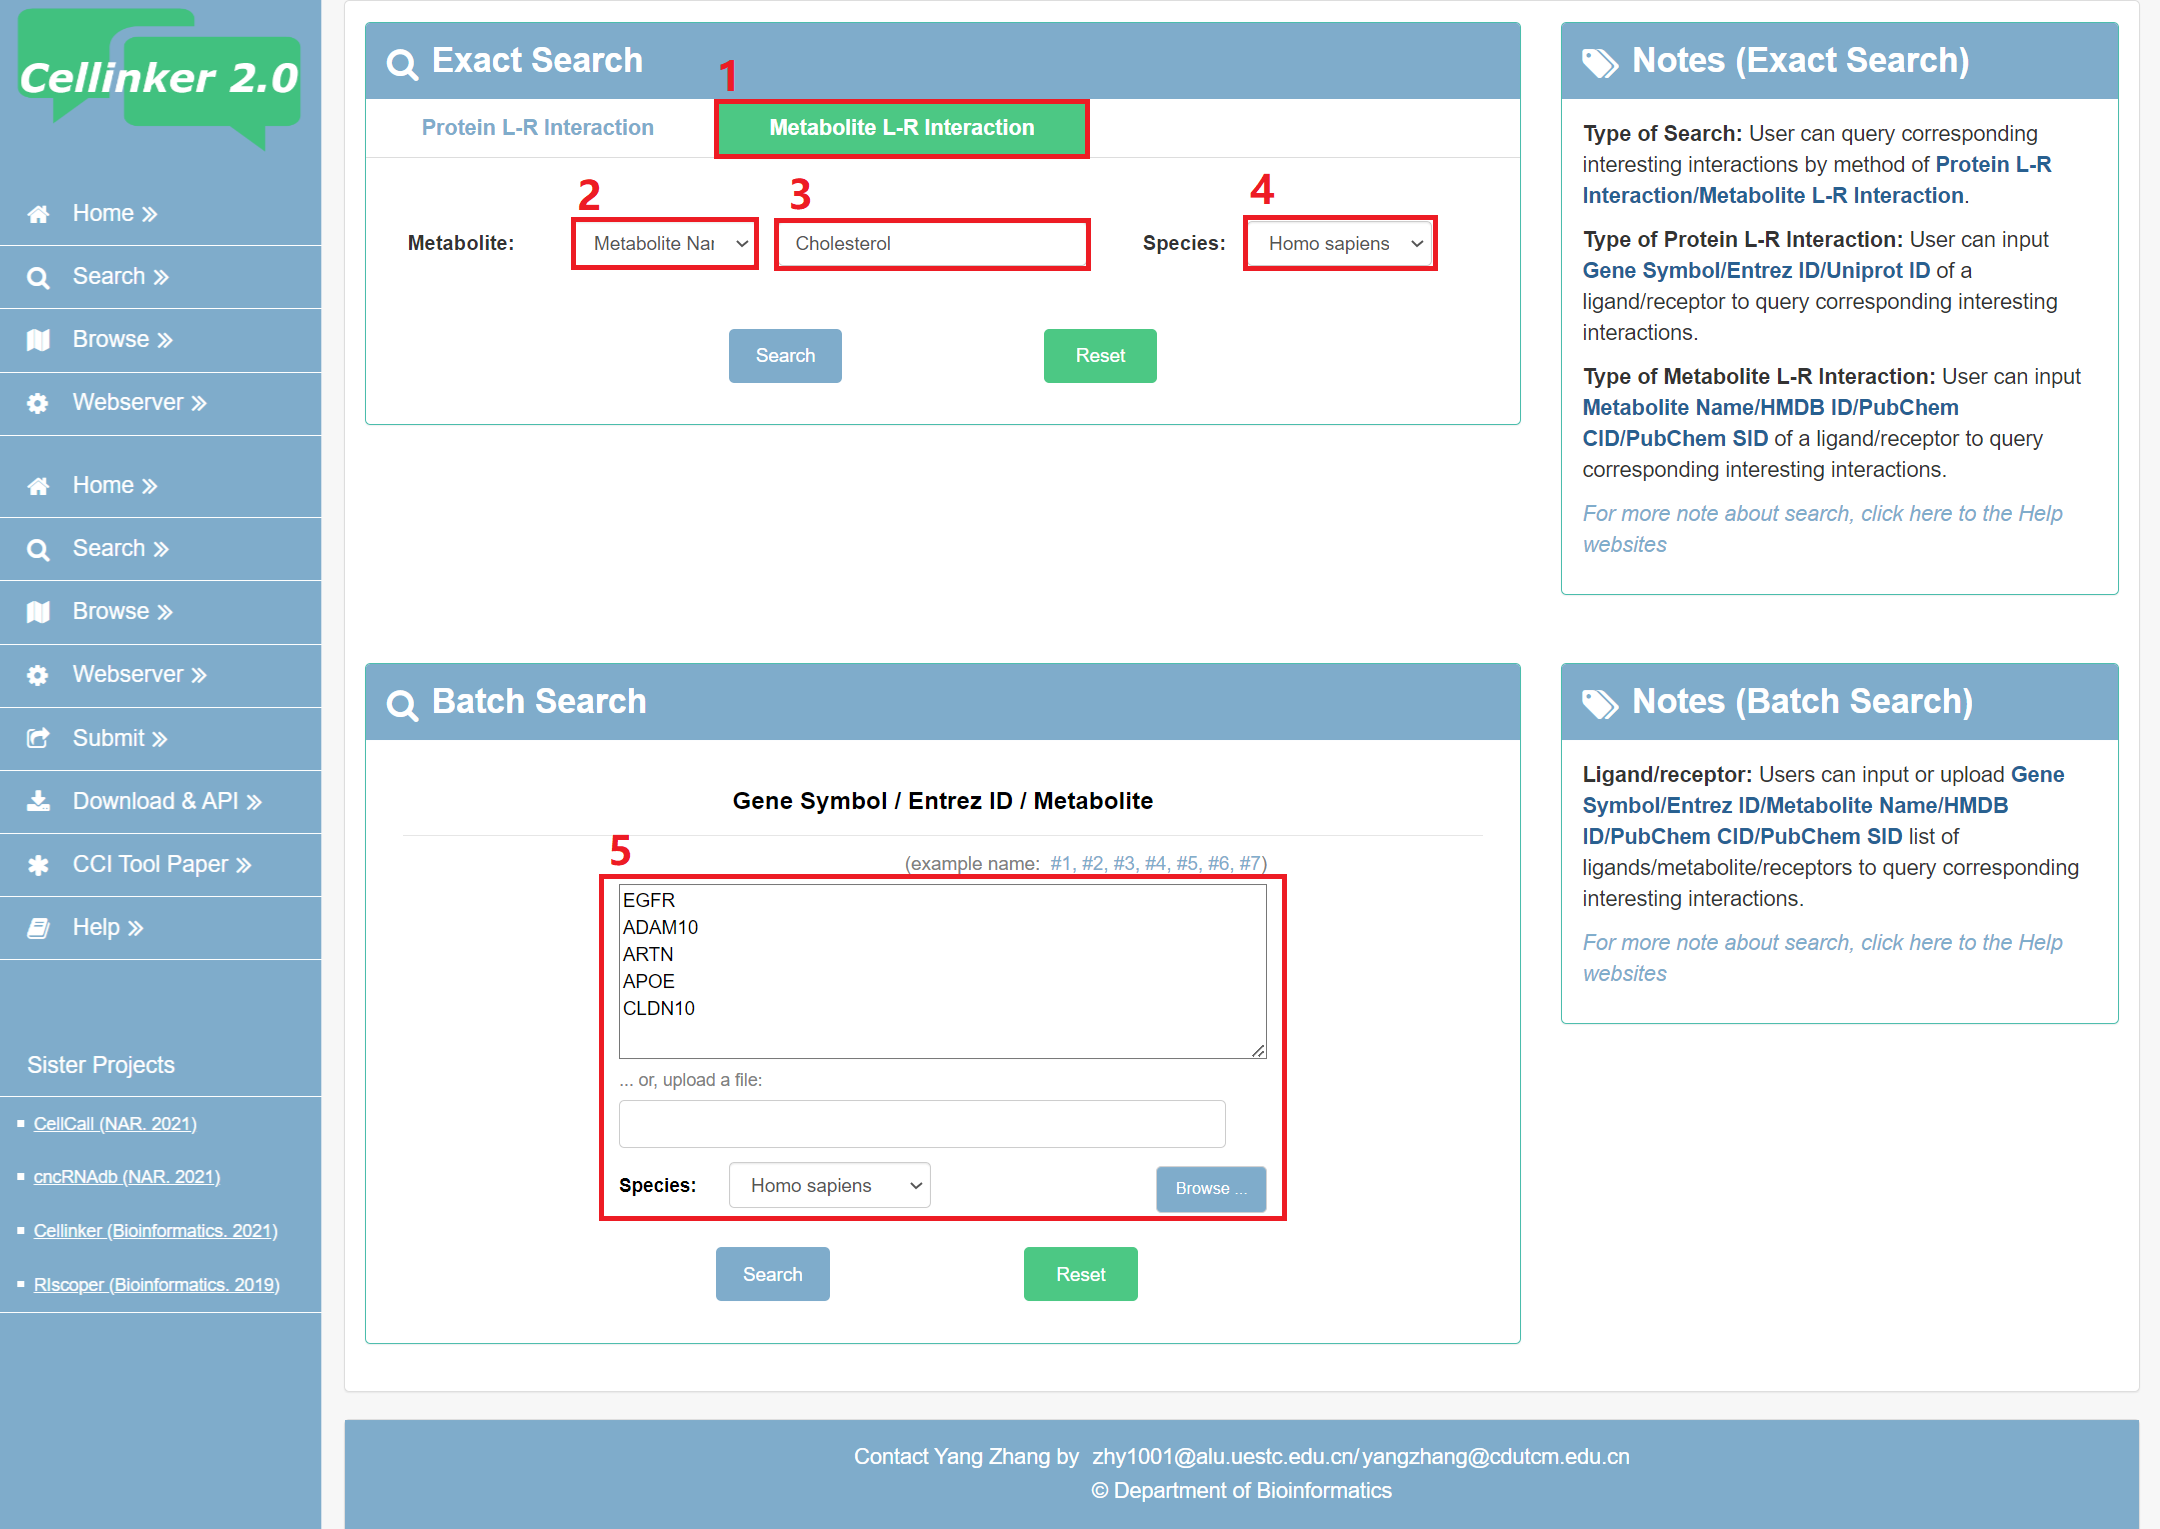
Fig 2-2. Search page of metabolite L-R interaction
To help users view and interactively analyze ligand-receptor interactions, the result page provides a table and an embedded sankey diagram web tool.
Fig 3-1:
1. The table of the search results.
2. Total sum of results.
3. Download your search results.
4. Click to link to detail page.
5. Click to turn the page.
6. Ligand list.
7. Receptor list.
8. Download the sankey diagram.
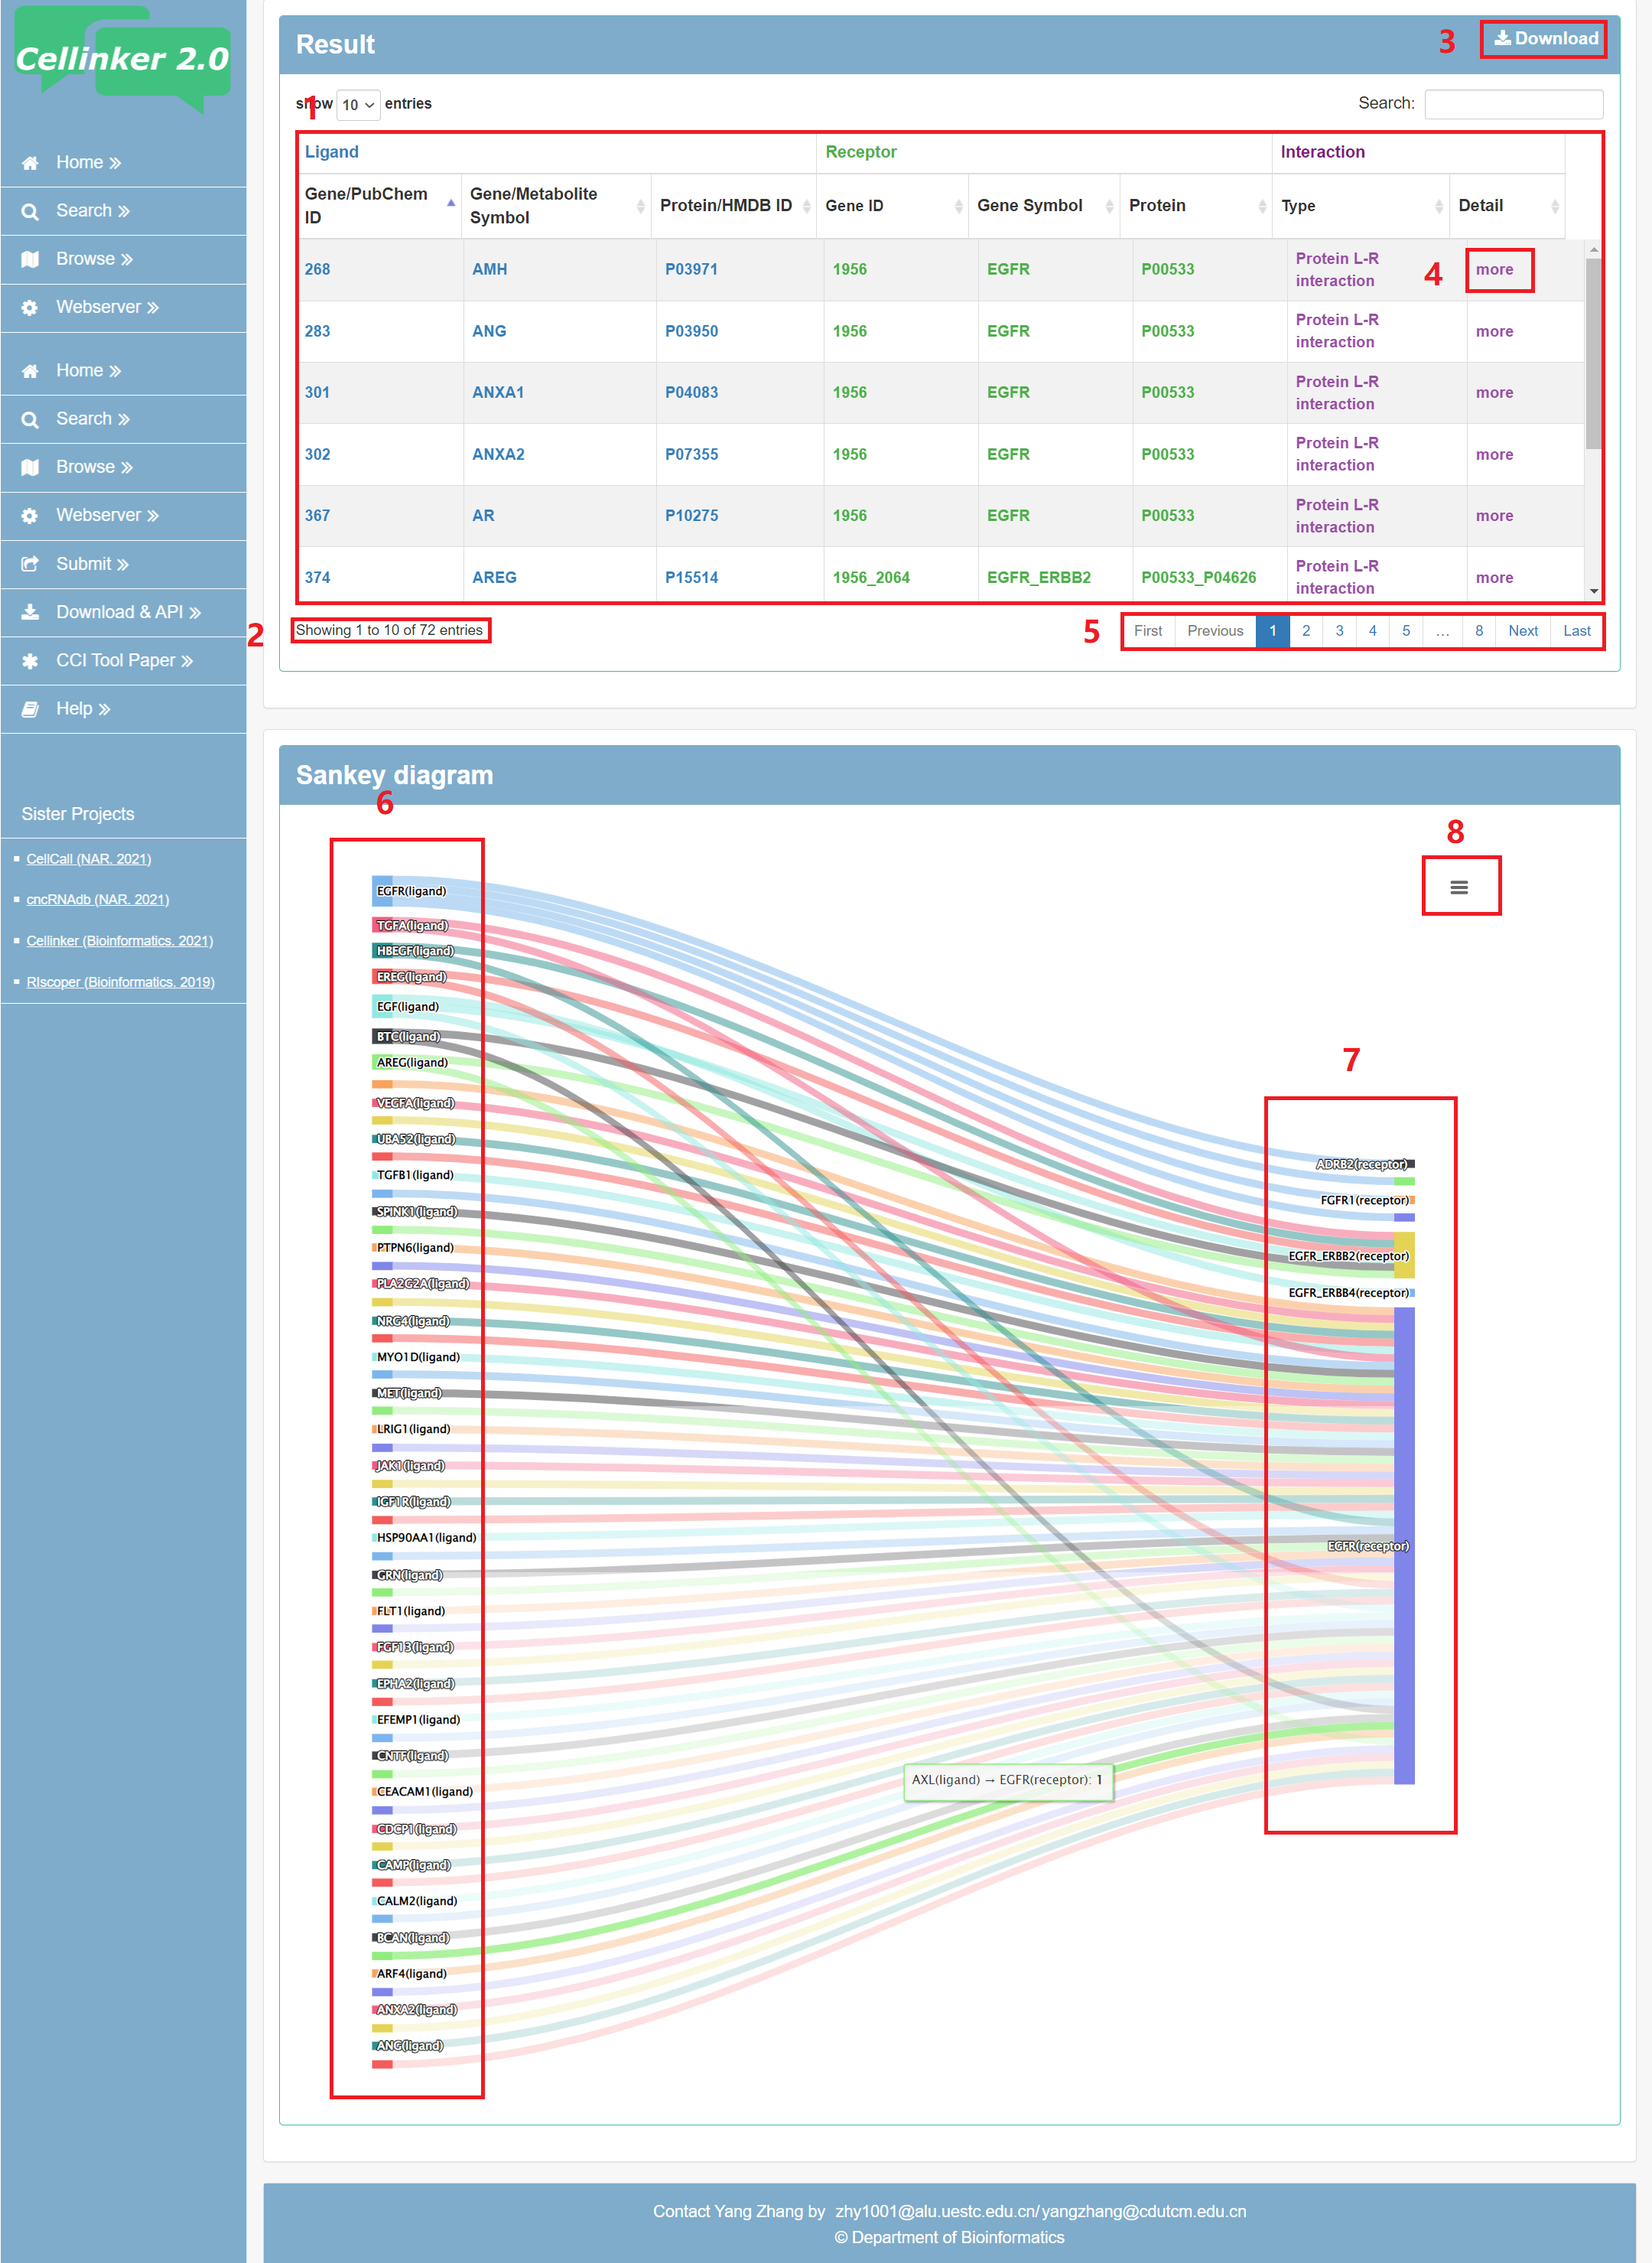
Fig 3-1. Search result page
In the detail page, you can get the detail information of the ligand-receptor interaction.
Fig 4-1: detail page of protein L-R interaction
1. Information of interaction: including interaction type and species.
2. Information of ligand/receptor: including gene symbols, Entrez gene ID, Uniprot ID or subunits for ligand/receptor complex.
3. The expression of ligand/receptor in scRNA-seq data across different tissues and cell types.
4. The expression of ligand/receptor in bulk RNA-seq/microarray data across different tissues.
5. Source of the interaction (publications and/or database).
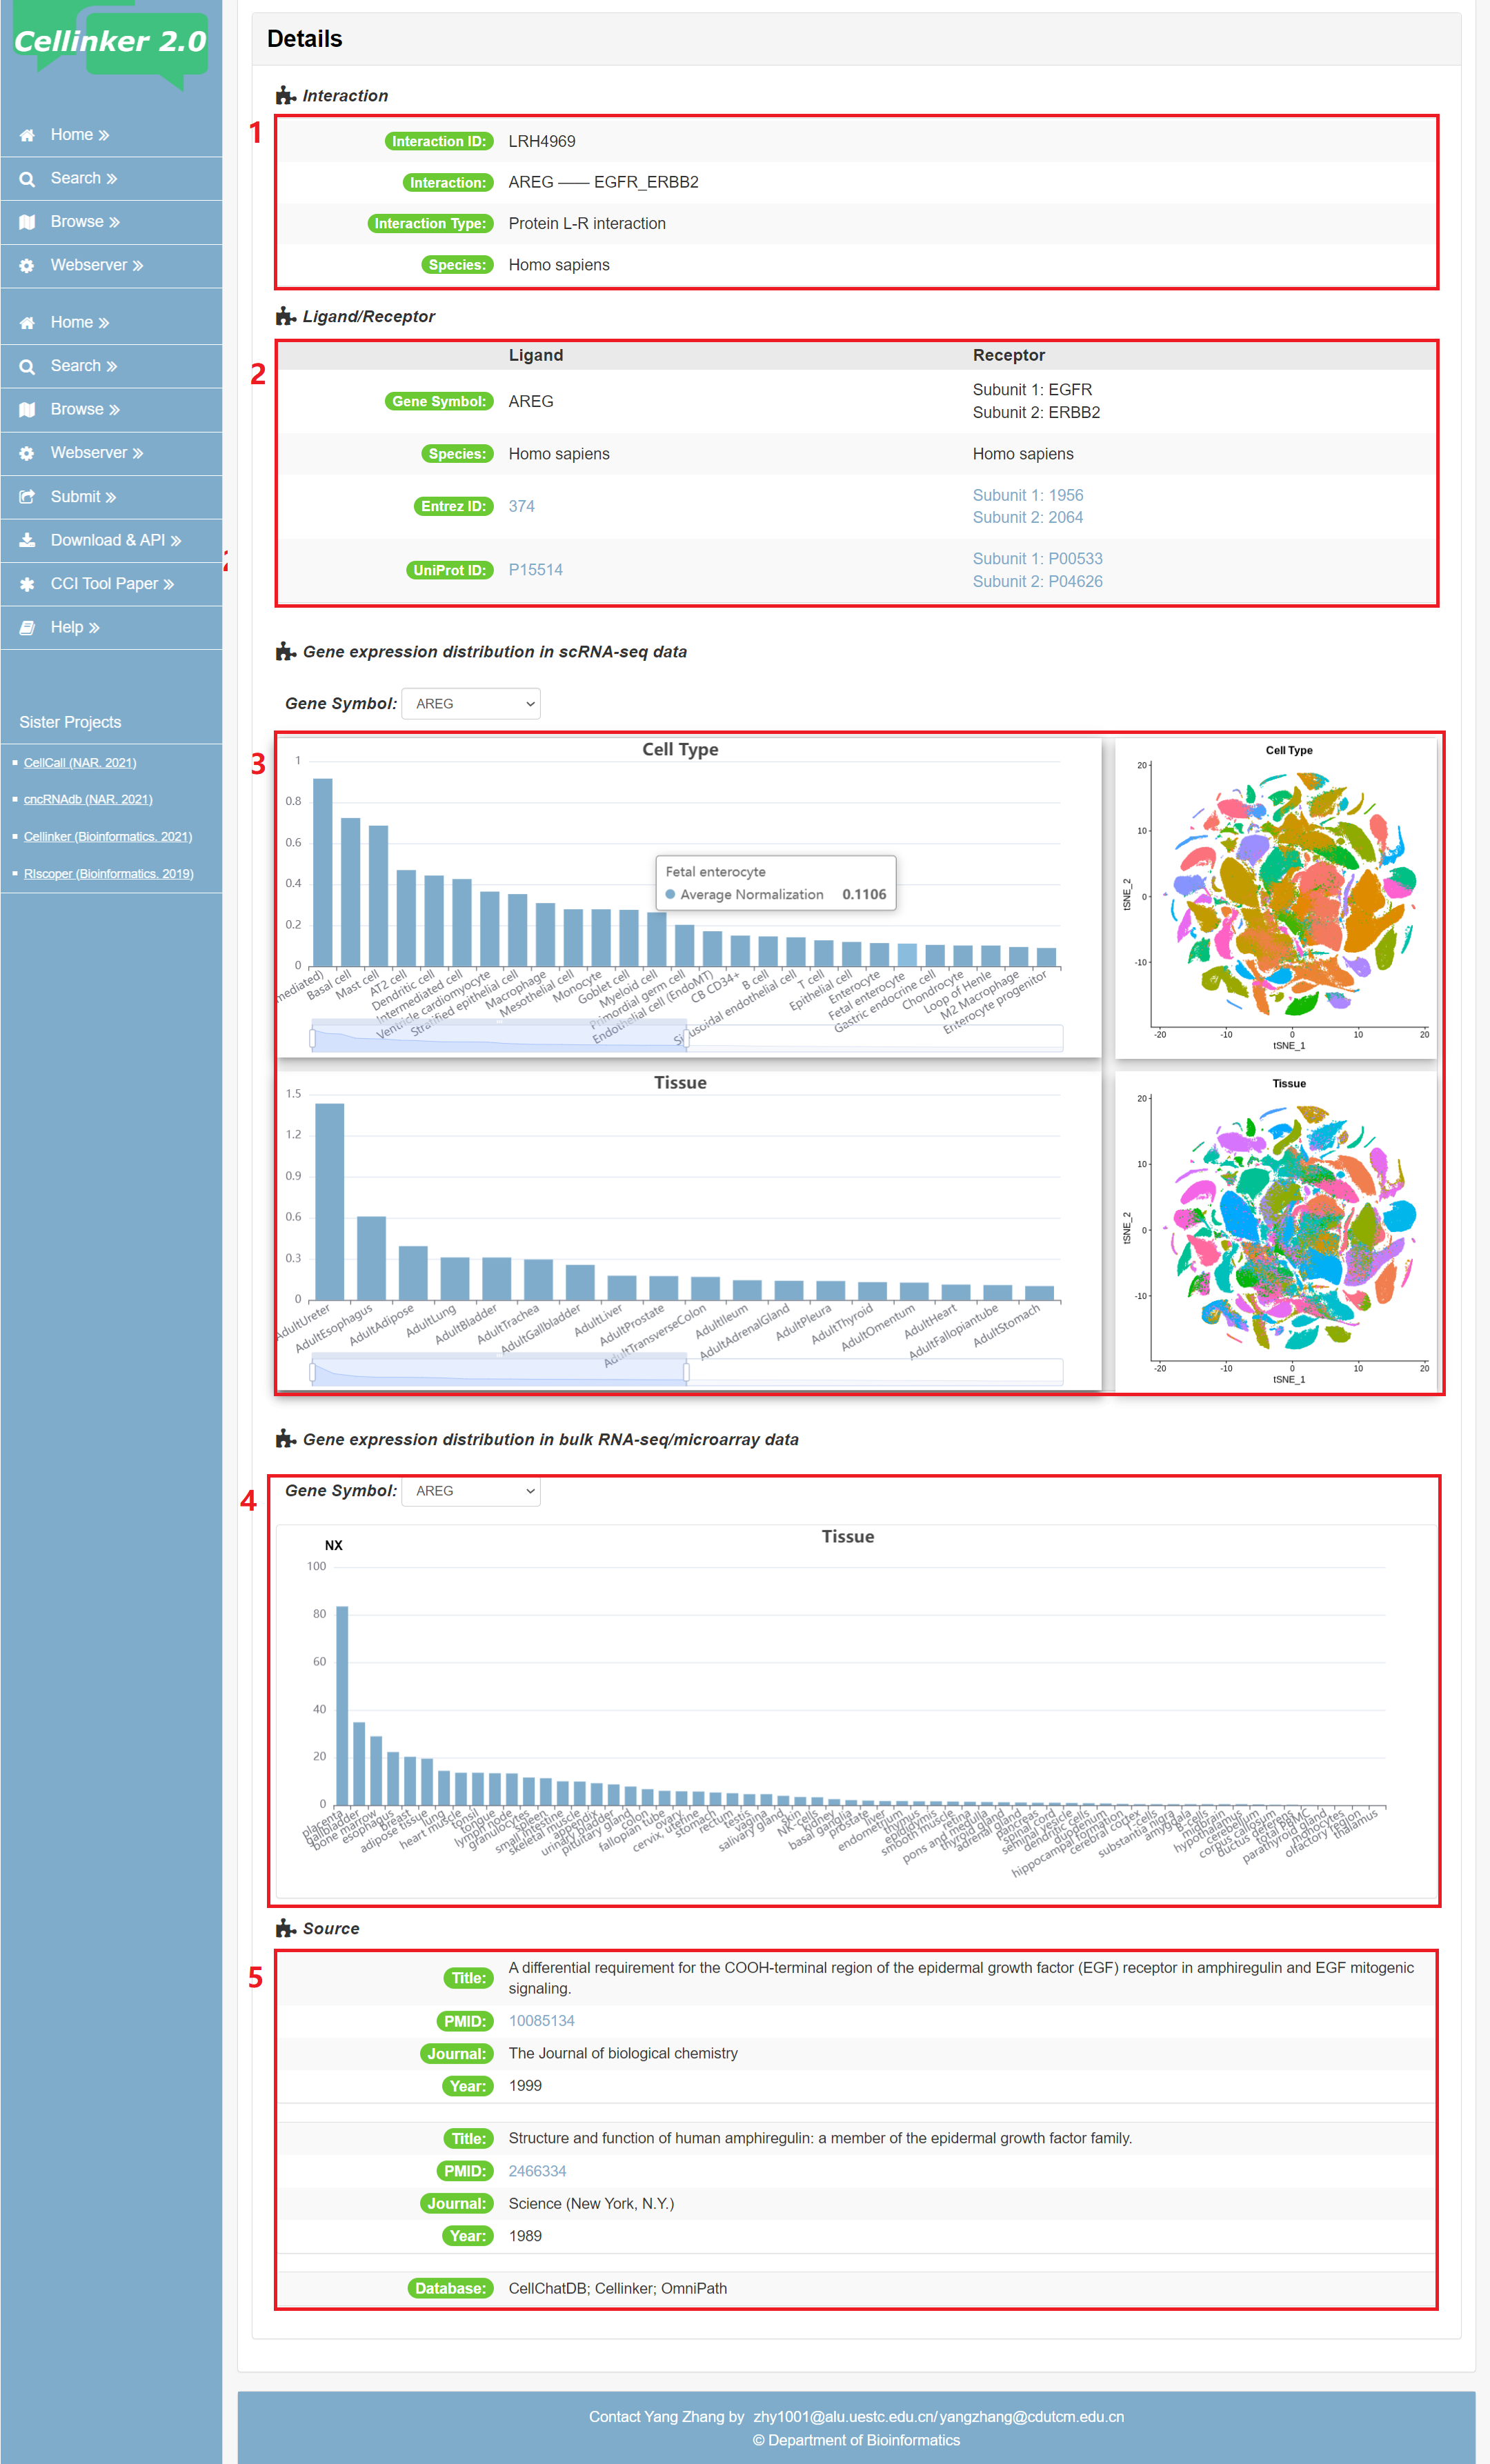
Fig 4-1. Detail page of protein L-R interaction
Fig 4-2: detail page of metabolite L-R interaction
1. Information of interaction: including interaction type and species.
2. Information of ligand/receptor: including gene symbols, Entrez gene ID, Uniprot ID, PubChem CID/SID, HMDB ID or subunits for receptor complex.
3. Detail information of the metabolite ligand, including name, Formula, Kingdom, Super Class, Class and Canonical SMILES.
4. List of enzymes involved in the metabolite ligand, including their names, symbols, UniProt IDs, reactions related to the metabolite, and their roles. Use 's' to indicate when the metabolite ligand serves as the substrate for the enzyme, and 'p' to indicate when the metabolite ligand is produced by the enzyme.
5. List of transporters protein involved in the metabolite ligand.
6. The expression of receptor in scRNA-seq data across different tissues and cell types.
7. The expression of receptor in bulk RNA-seq/microarray data across different tissues.
8. Source of the interaction (publications and/or database).
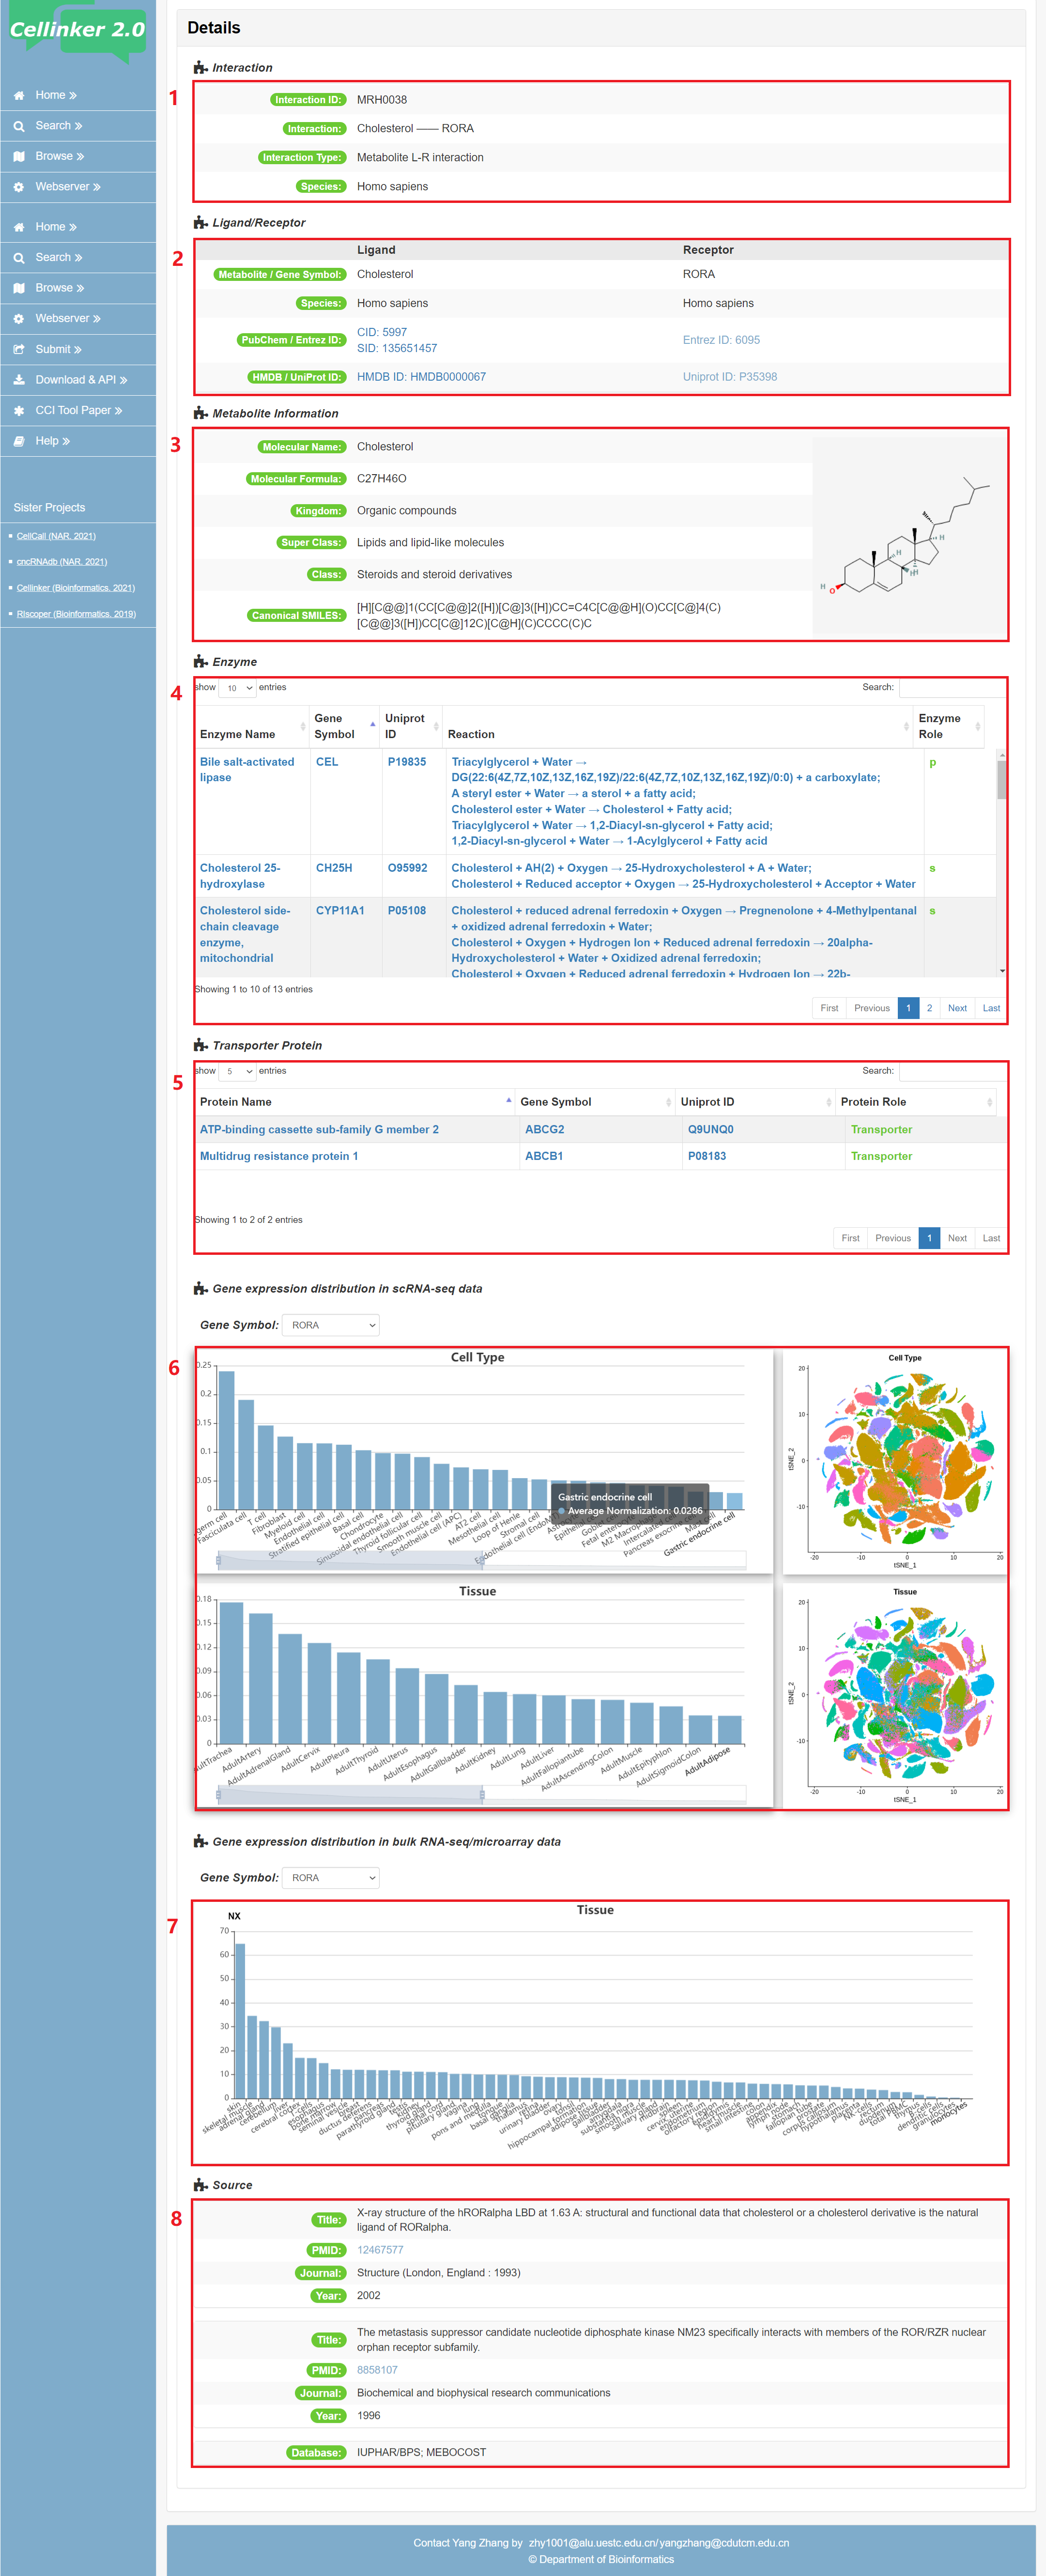
Fig 4-2. Detail page of metabolite L-R interaction
Notes:
Human and mouse scRNA-seq data across different tissues and cell types were collected from the MCA database, a total of 344000 human cells (refers to 52 cell types and 35 tissues) and 174455 mouse cells (refers to 44 cell types and 26 tissues) were adopted
The human gene expression profiles across 62 tissues were collected from The Human Protein Atlas project (RNA consensus tissue gene data), and the mouse expression profiles across 39 tissues were collected from TISSUES 2.0 database (GeneChip data).
Cellinker 2.0 divide all interactions into protein L-R interaction and metabolite L-R interaction. Users can browse the data by species and interaction types (by click on the correct icon in Figure 5-1). Moreover, the statistics information of Cellinker 2.0 is also presented in browse page.
Fig 5-1:
1. Browse by species and interaction types.
2. Statistics information of Cellinker 2.0.
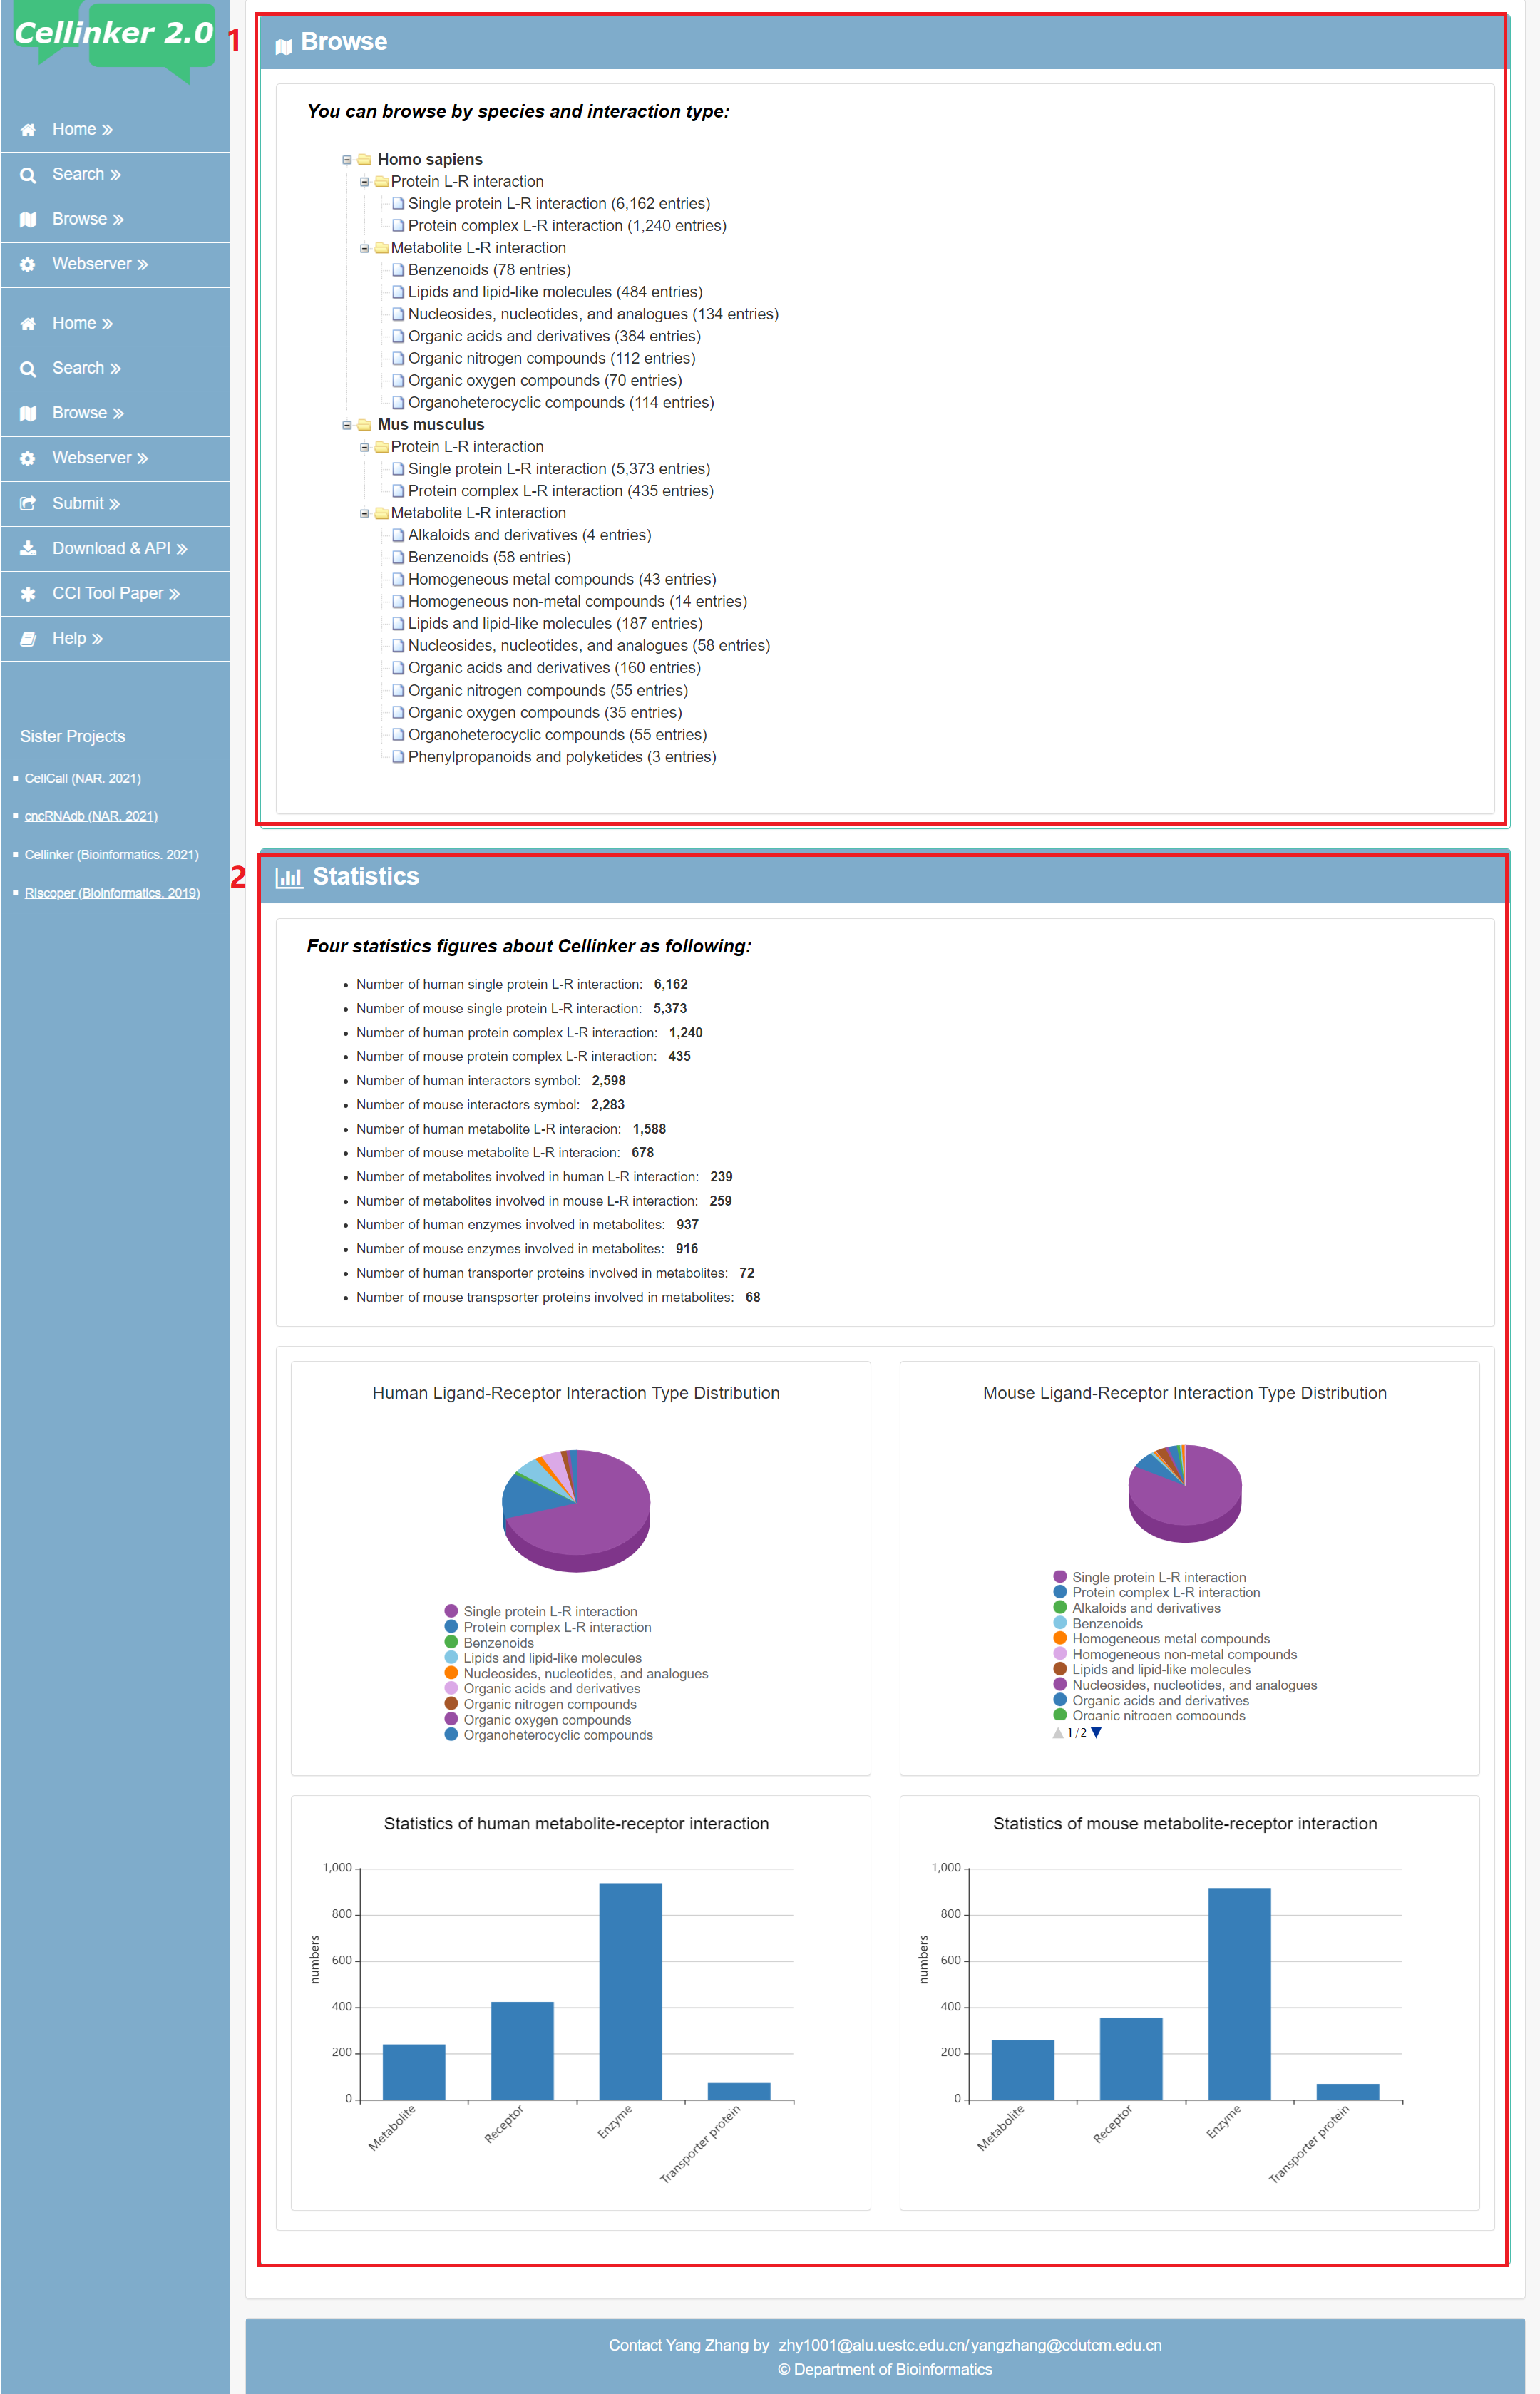
Fig 5-1. browse page
For the convenience of users, Cellinker 2.0 launched web server for intercellular communication analysis.
Fig 6-1:
1. Select to do analysis of the protein L-R interaction based intercellular communication.
2. Select to do analysis of the metabolite L-R interaction based intercellular communication.
3. Select species of scRNA-seq data.
4. Upload the meta file of your own scRNA-seq data (max 20 MB), zip file is recommended.
3. Upload the counts file of your own scRNA-seq data (max 20 MB), zip file is recommended.
4. The minimum ratio of expressed ligand/receptor in a cell type.
5. The threshold of the P-value (permutation test).
6. Number of statistical iterations of the permutation test (max 1000).
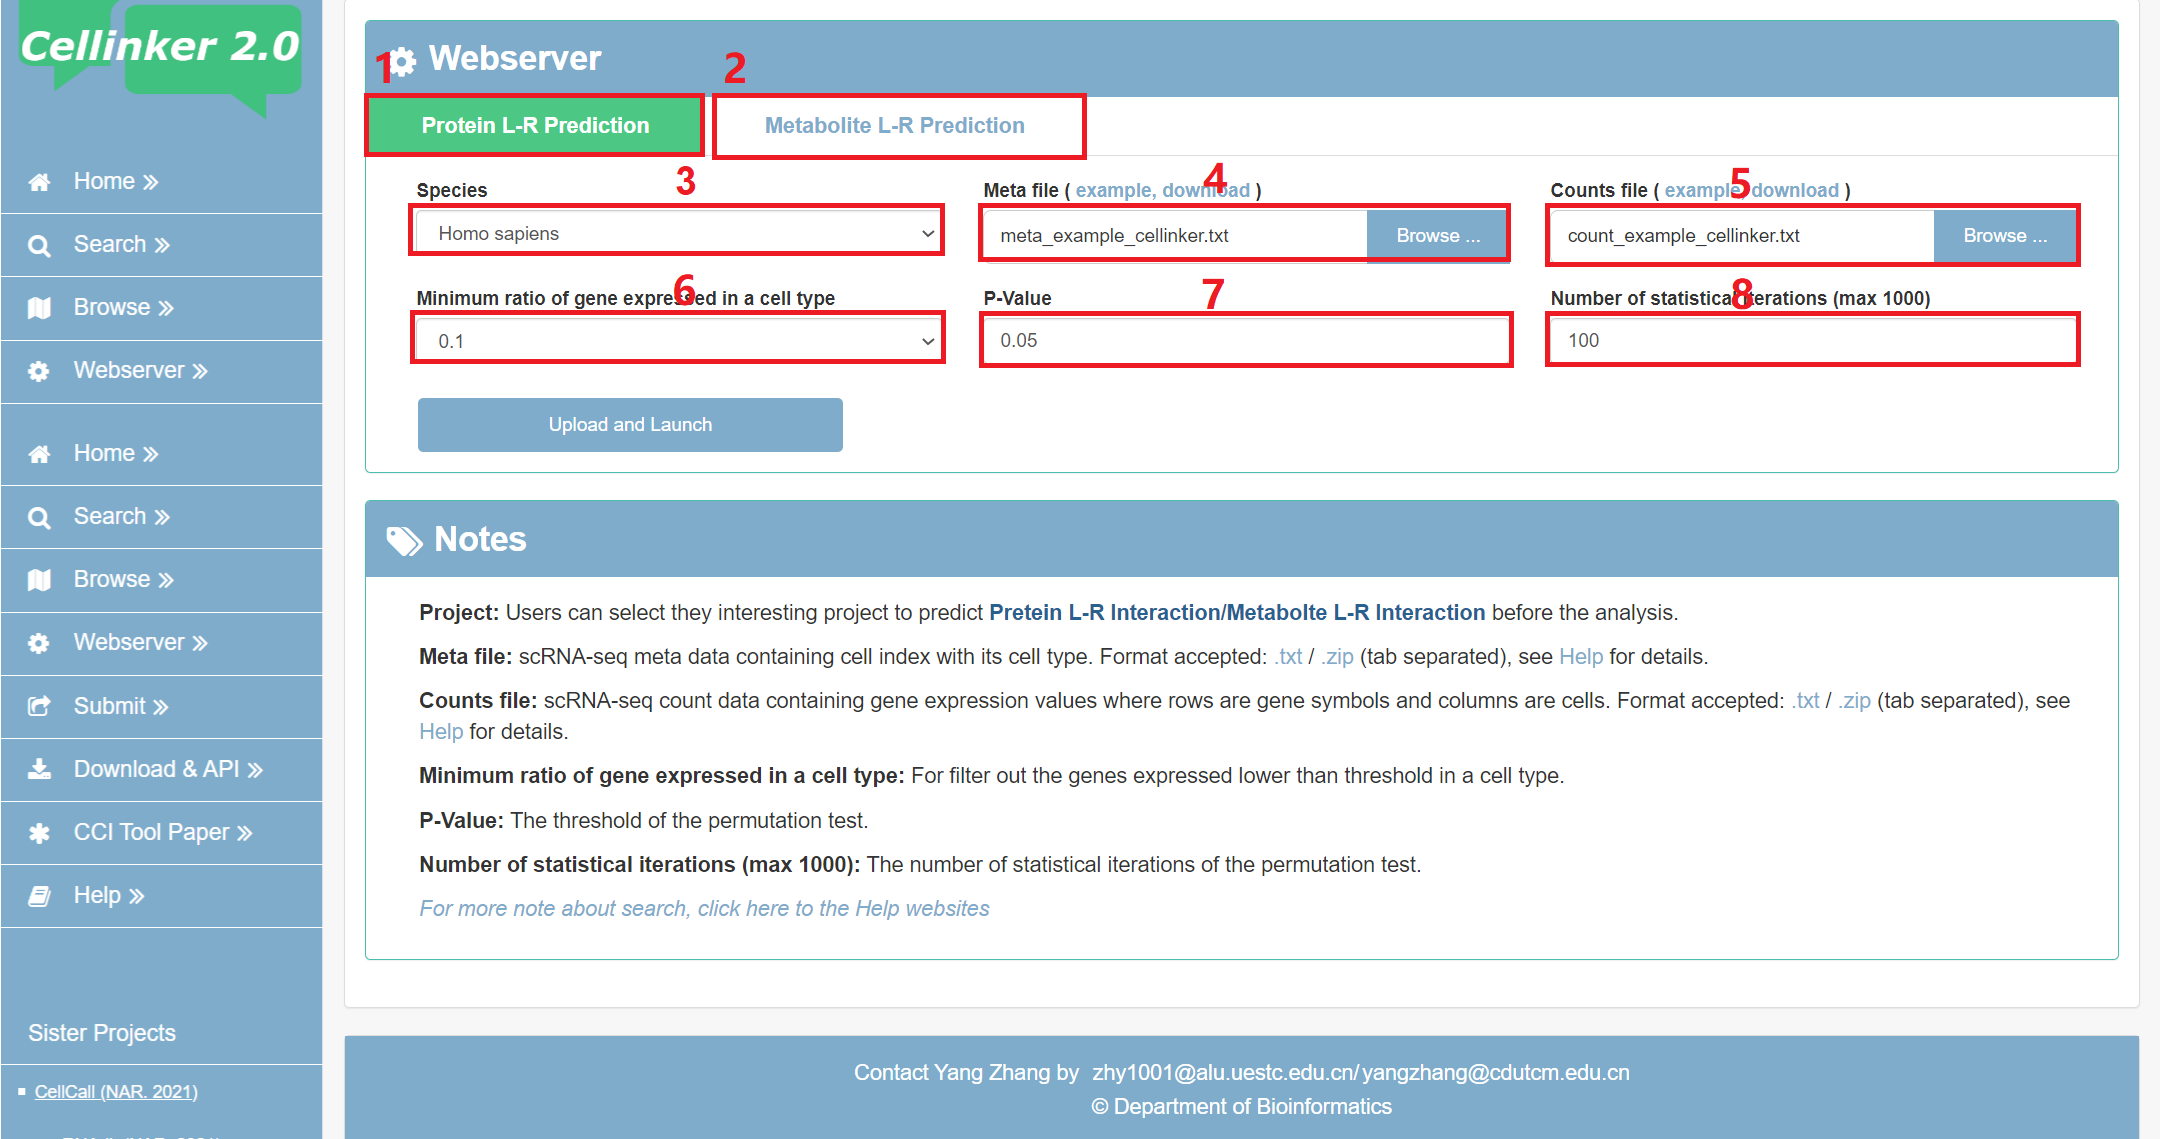
Fig 6-1. webserver page
The format of the meta file is as follow table:
1. The first column: cell IDs.
2. The second column: cell types.
| X397_Dendritic.cells | Dendritic.cells |
| X261_NK.cells | NK.cells |
| X607_T.cells | T.cells |
The format of the counts file is as follow table:
1. The first column: gene symbols.
2. The first row: cell IDs.
3. Other place: the expression values (counts or TPM) for a gene in a cell.
| X261_NK.cells | X607_T.cells | X501_T.cells | X383_Dendritic.cells | |
| TNFRSF18 | 0 | 3.204732 | 0 | 0 |
| TNFRSF4 | 7.881338 | 0 | 0 | 0 |
The result page provides an embedded bubble chart web tool to display the results. (see Fig 6-2).
1. Download the score file.
2. Download the P-value file.
3. Download the bubble chart.
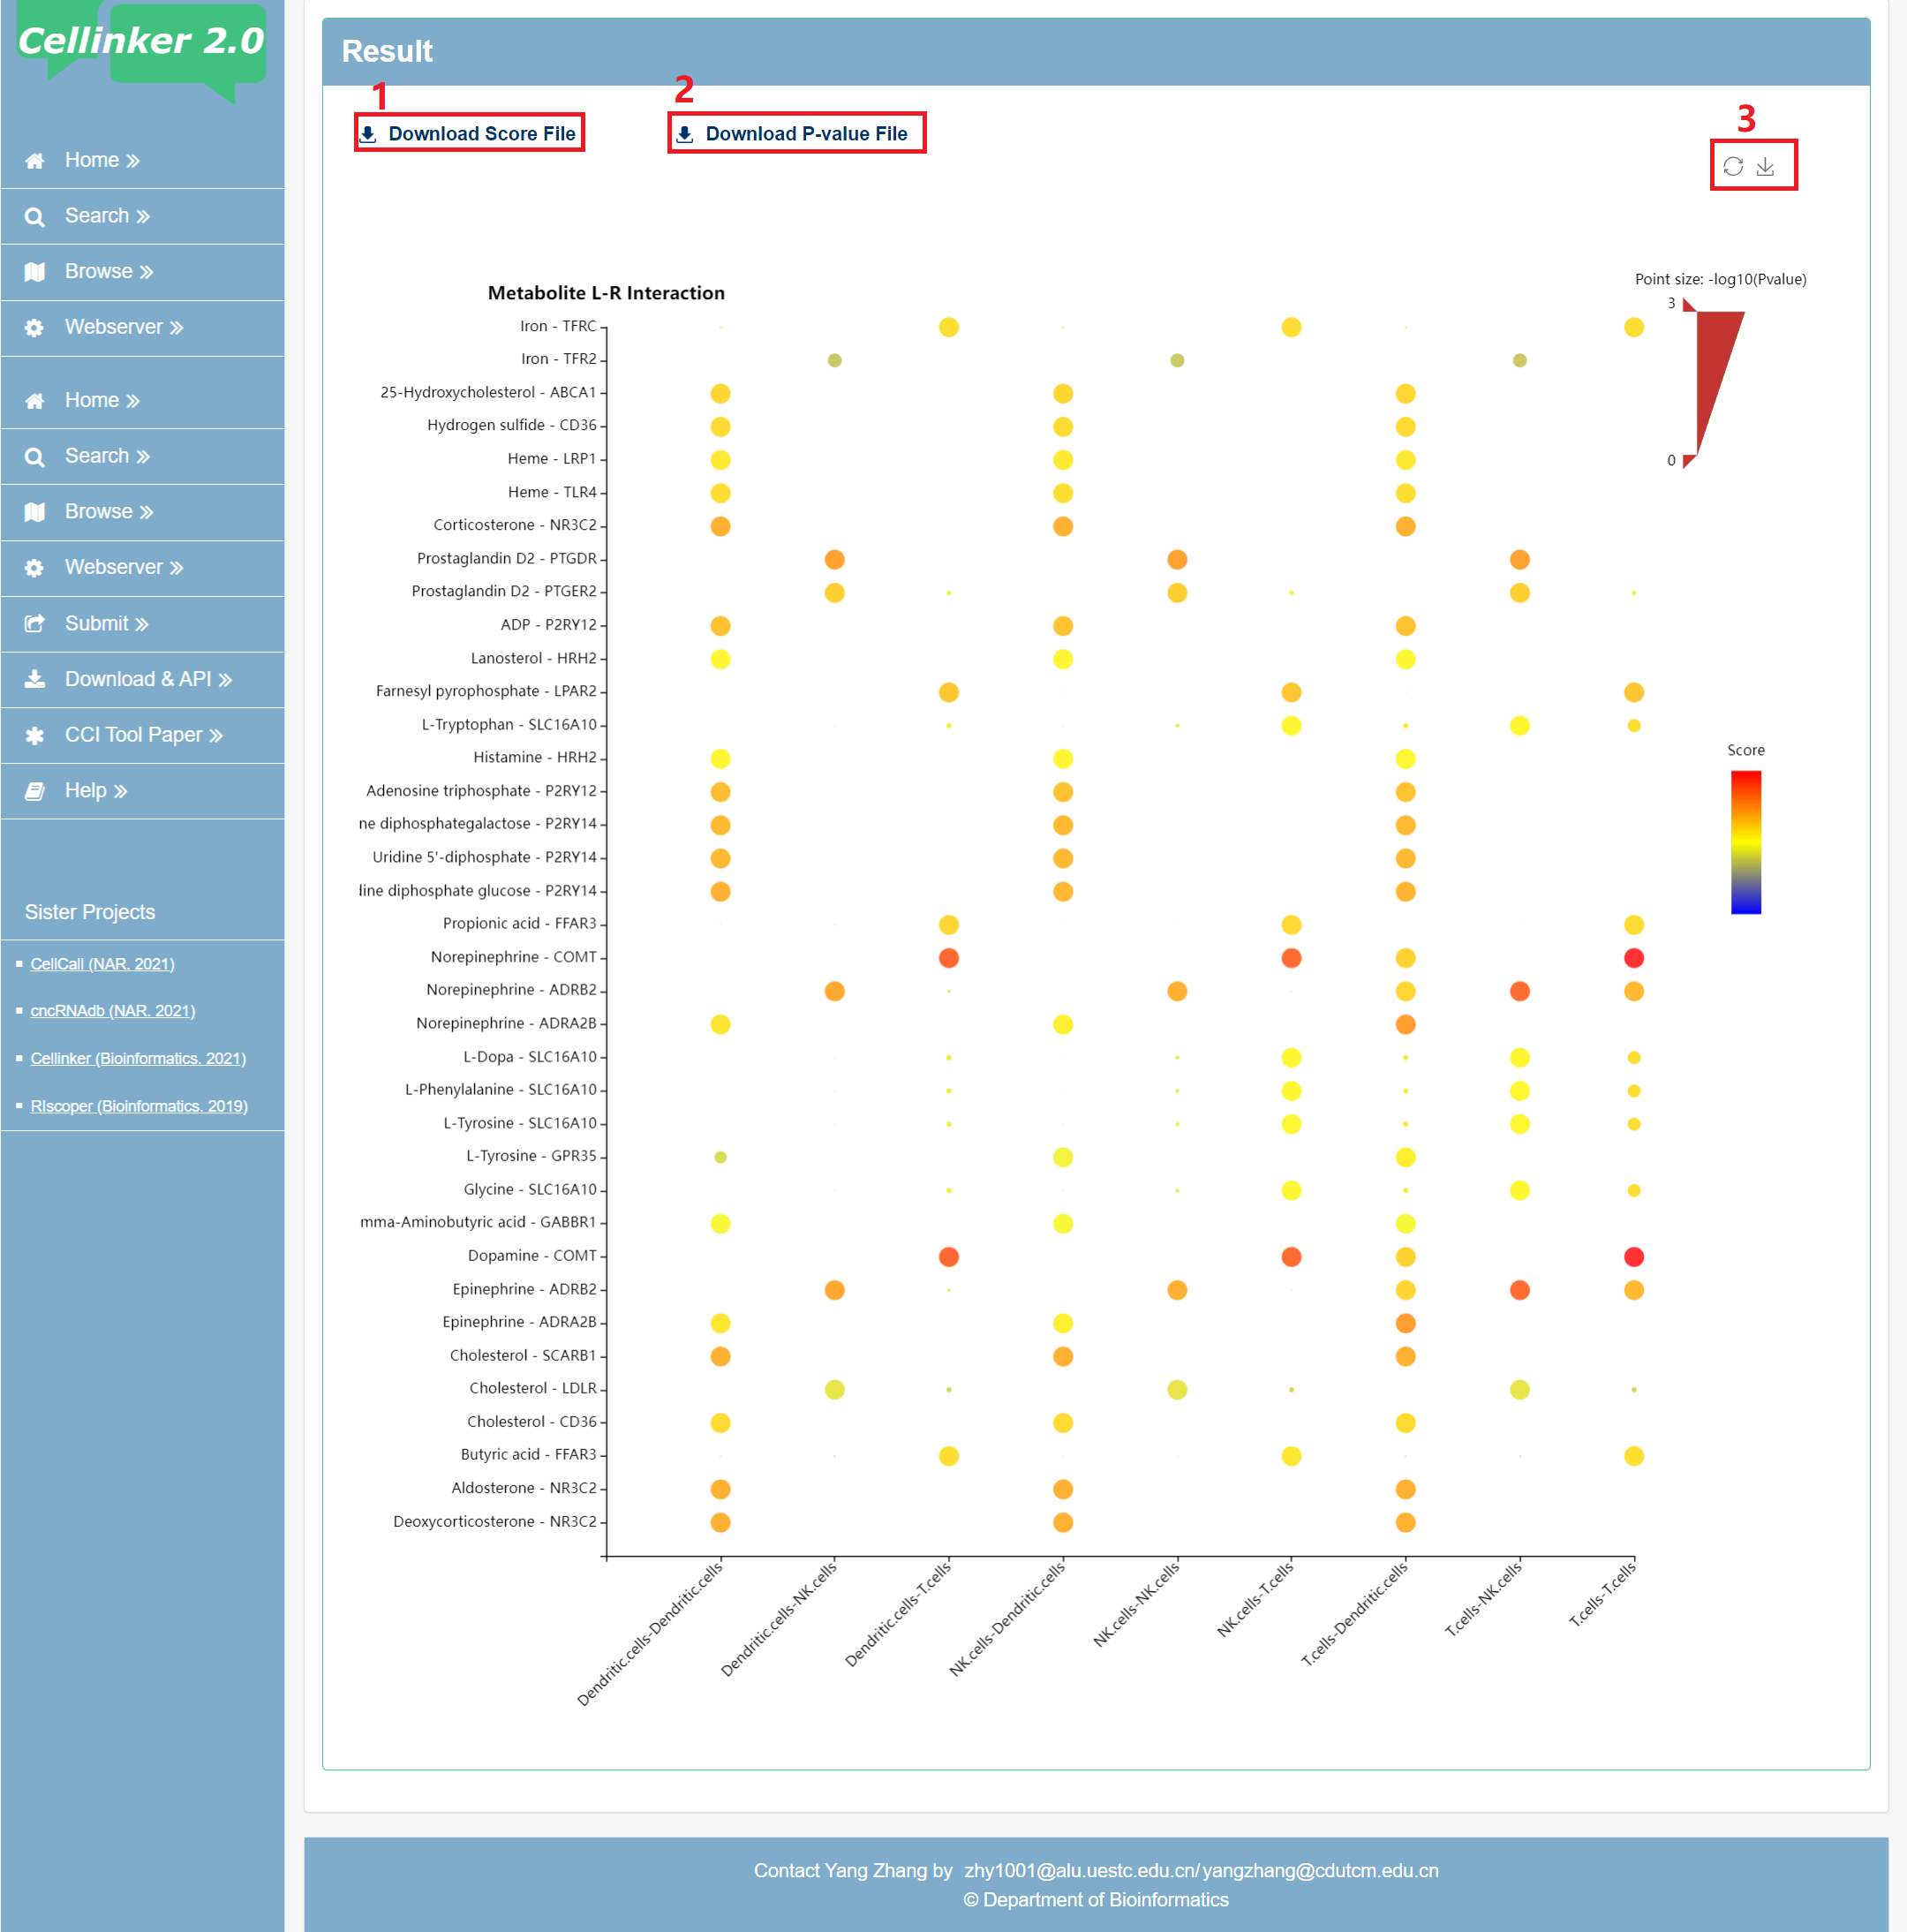
Fig 6-2. the results page of the webserver
Notes:
The results of the analysis contain two measures, score and P-value (default: P < 0.05).
Over the past three years, over 70 bioinformatics methods and resources focusing on cell-cell communication prediction have been published. To provide users with a quick overview of the latest advancements in cell-cell communication prediction research, Cellinker 2.0 has curated a list of relevant papers on its database website (publications of CCI Tools). Moving forward, we will continue to update this list.
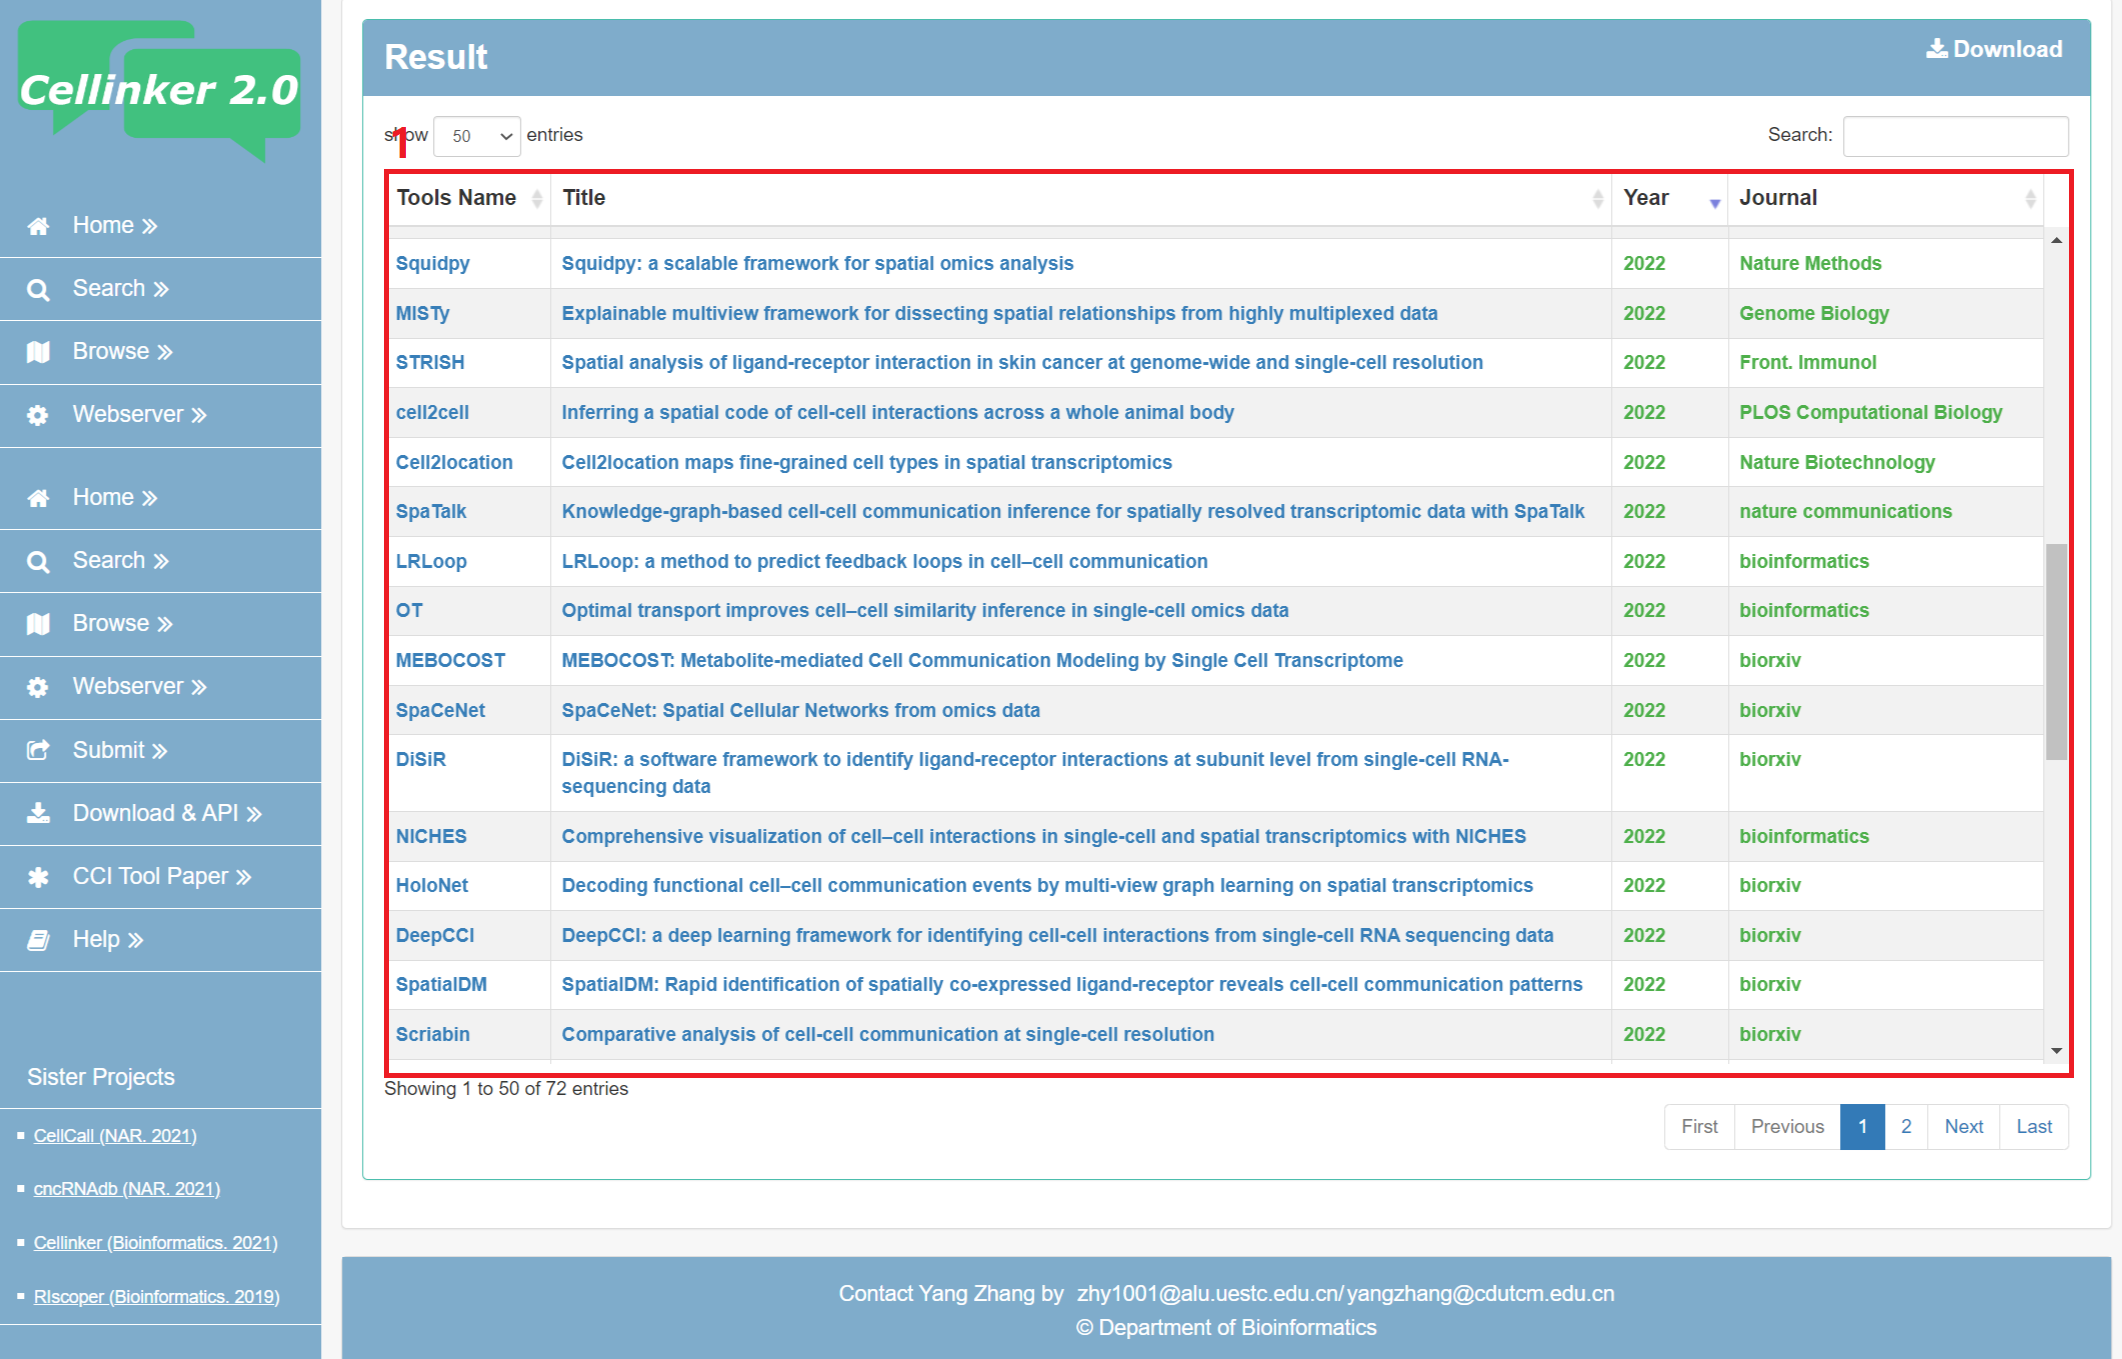
Fig 7-1. Page of publications of CCI Tools