Overview:
TCMAP documents more than 200 TCM formulas for treating acute pancreatitis and over 50 NMs, involving more than 430 herbs registered in the HERB database, all sourced from literature, patents, and public sources. Meanwhile, TCMAP has launched a useful web server for querying, analyzing, and visualizing documented formulas similar to those supplied by the user (formula similarity analysis). In summary, TCMAP provides a user-friendly and practical platform for documenting, querying, and browsing TCM treatments for acute pancreatitis, and will help in the development and elucidation of the mechanisms of action of new TCM therapies for acute pancreatitis, bringing more treatment options and better prognosis for patients with acute pancreatitis.
The homepage is displayed in the following Fig 1-1:
1. Main functions of the database are provided in menu bar form (boxed in red).
2. Introduction and overview for TCMAP.
3. Browse the formulas, herbs and NMs data.
Fig 1-1. Home page
The search page is displayed in Fig 2-1:
1. Formula Search: users can enter a formula Chinese name/Pinyin name to search for formulas treating acute pancreatitis.
2. Natural Metabolite Search: users can enter an NM name/formula/PubChem CID to search for NMs treating acute pancreatitis.
3. Herb Search: users can enter an herb Chinese name/Pinyin name/English name to search for herbs related to acute pancreatitis formulas and NMs.
Fig 2-1. Search page
In the result page, all entries are listed with basic information including Chinese name, Pinyin name, English name, Dosage form, etc.
The search result page is displayed in Fig 3-1:
1. The result table of formula search.
2. The result table of NM search.
3. The result table of herb search.
4. Search from the result table.
Fig 3-1. Search result page
In the detail page, you can get detailed information of formulas, NMs and herbs for treating acute pancreatitis.
The detail page of formula is displayed in Fig 4-1:
1. Basic Information: including formula Chinese name, Pinyin name, Dosage form, Administration, Formula classification, and herbs contained in this formula (Chinese name) and herbs contained in this formula (Pinyin name).
2. Into Serum Components(only some of the formulae have collected this data): including Components, Chemical formula, Ionmode, m/z
3. Targets Related to Acute Pancreatitis: including target name (Official Symbol), target Gene ID, and target source (including GeneCards and DisGeNet).
4. Target Pathway Enrichment Analysis: KEGG-based enrichment analysis was performed on the target gene list of the formula, and then the top ten significant pathways were screened and visualized.
5. Acute Pancreatitis Treatment Information: including Range of TCM Syndrome Application, Efficacy of TCM, Range of Clinical Application, Potential Mechanism and China Clinical Trial Registry Information.
6. The embedded network web tool: showing the herbs contained in this formula.
7. Source of the formula (publications or patents).
Fig 4-1. Detail page of formula
The detail page of NMs is displayed in Fig 4-2:
1. Basic Information: including NM English name, molecular formula, 2D-structure, 3D-structure, SMILES, PubChem ID, herb containing this natural metabolite in pinyin and in English.
2. Acute Pancreatitis Treatment Information: including species, tissue/cell line/body fluid and potential mechanism.
3. The embedded network web tool: showing herbs related with this natural metabolite.
4. Source of the NM (publications).
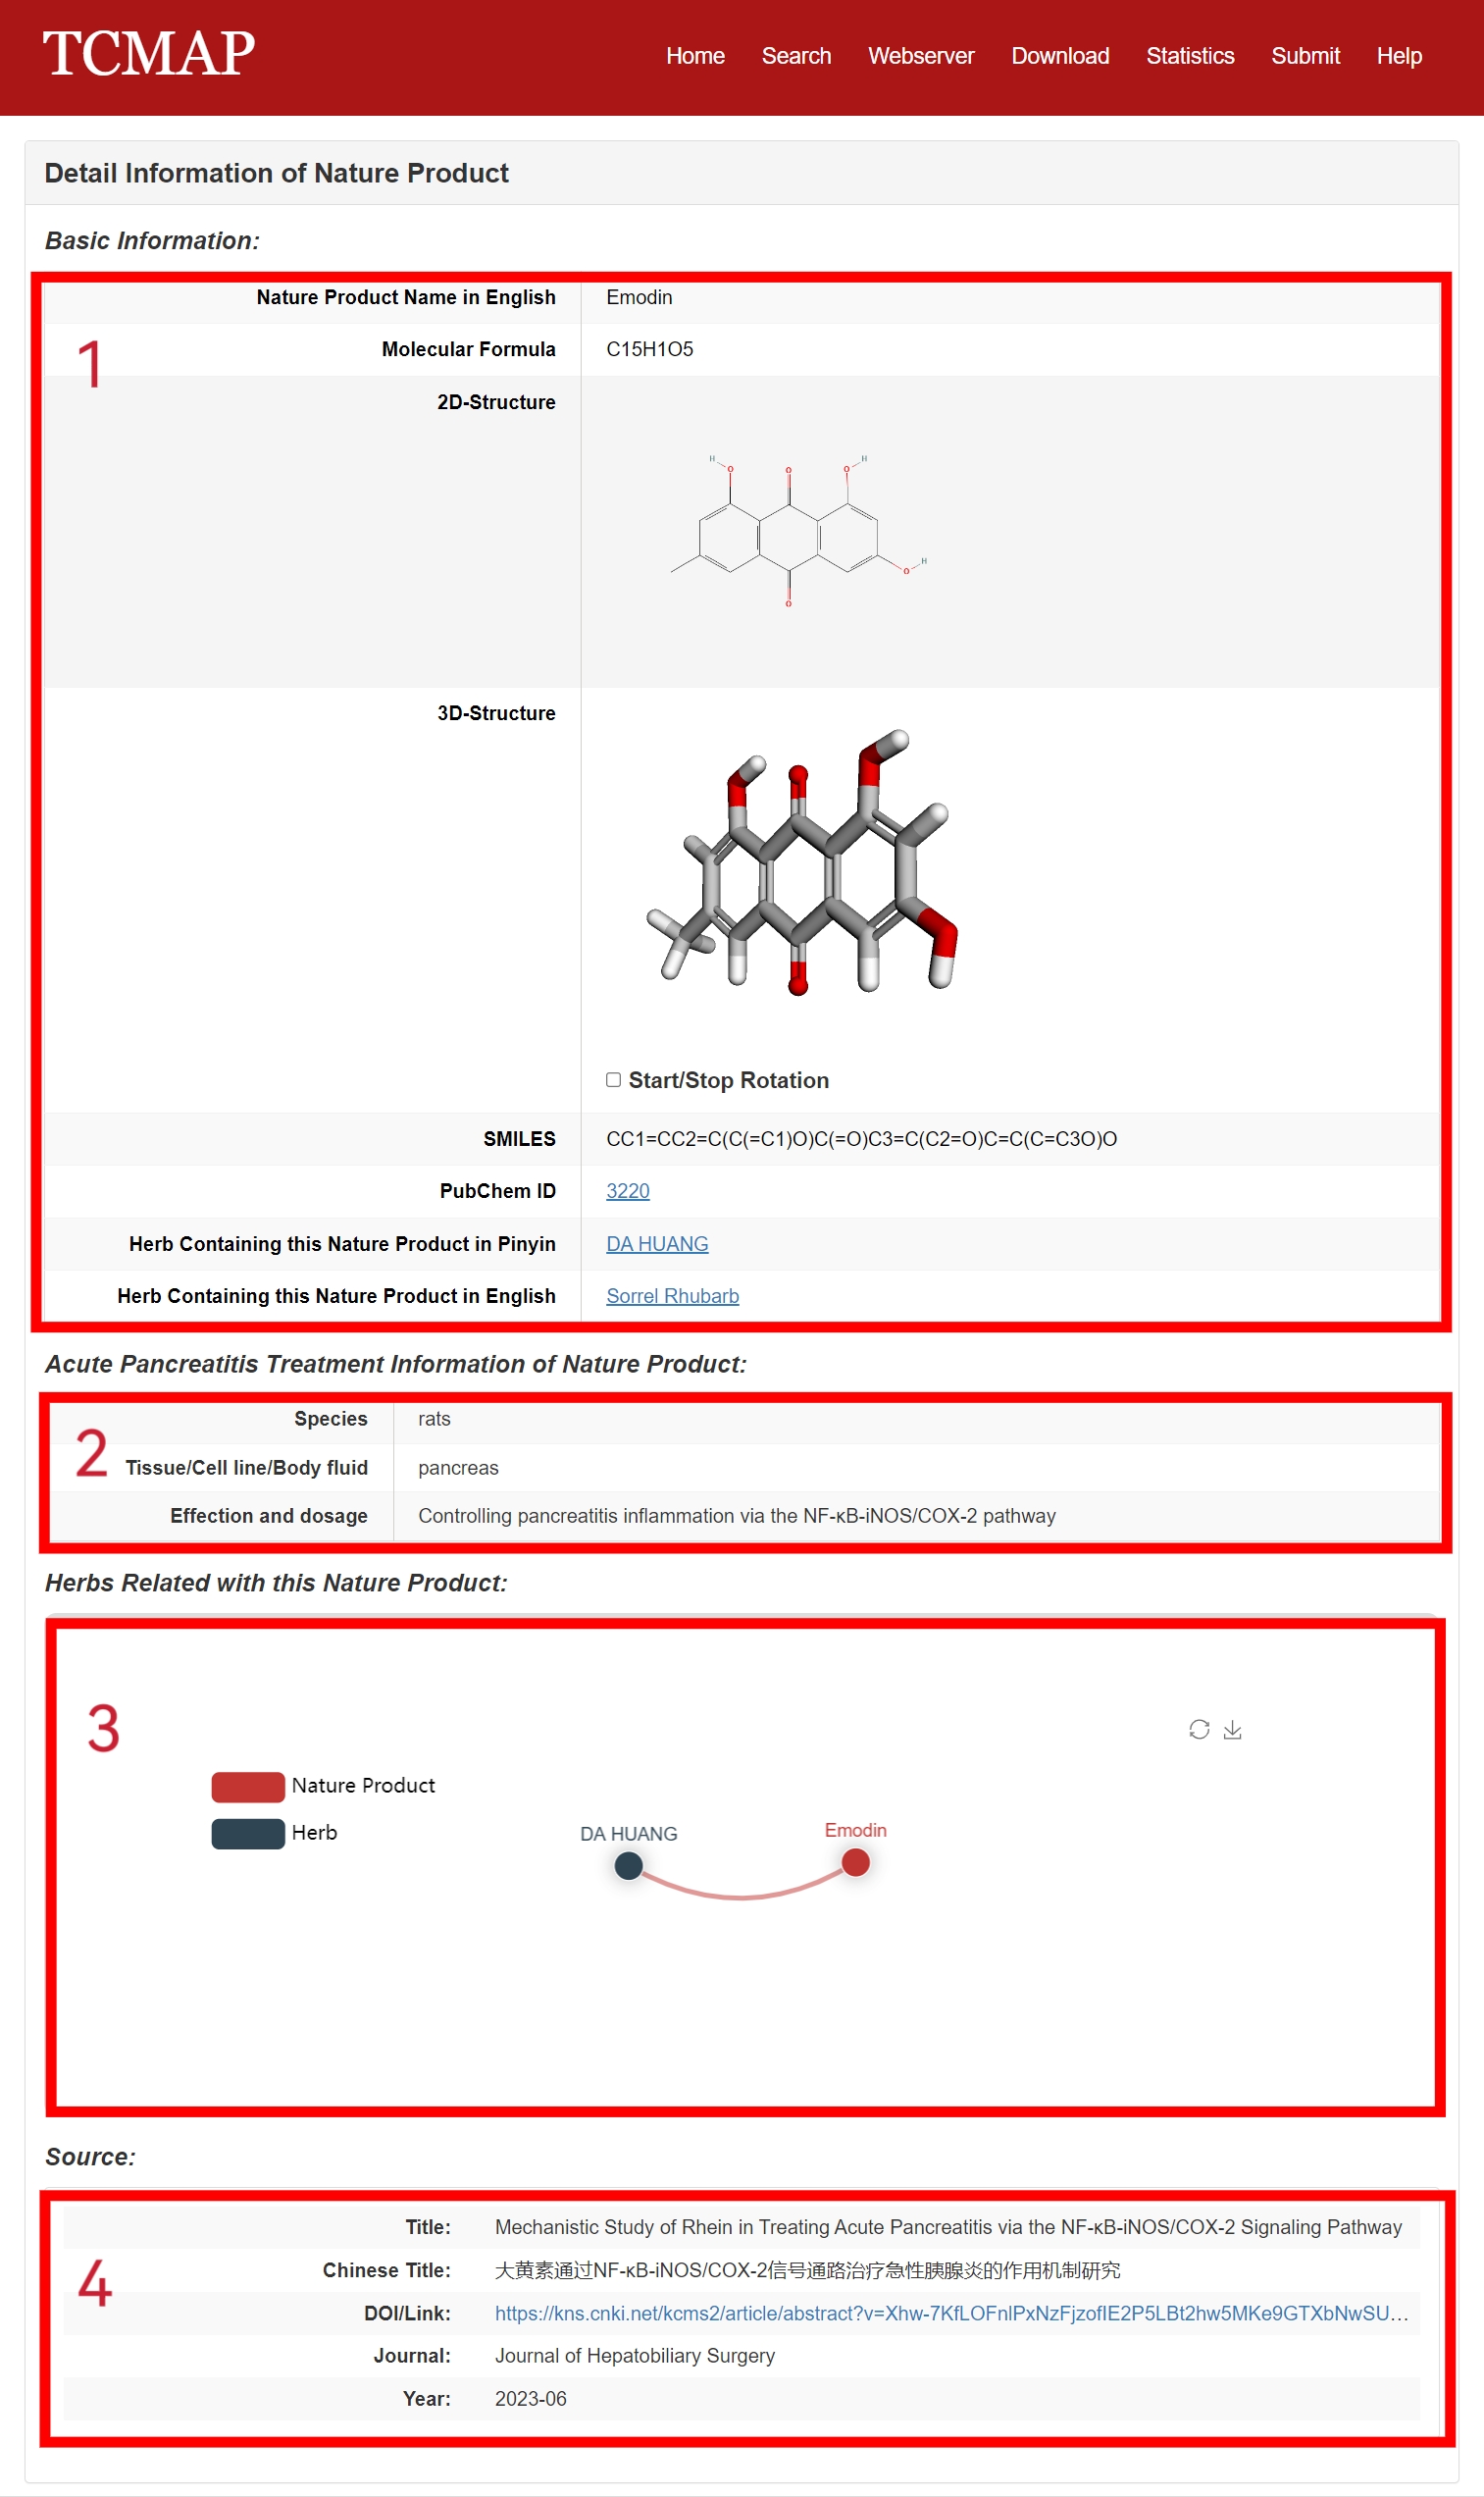
Fig 4-2. Detail page of NM
The detail page of Herbs is displayed in Fig 4-3:
1. Basic Information: including herb Chinese name, Pinyin name, English name, Latin name, properties, meridians, therapeutic class in Chinese, therapeutic class, efficacy and HERB id.
2. The embedded network web tool: showing formula included this herb.
3. The related metabolites.
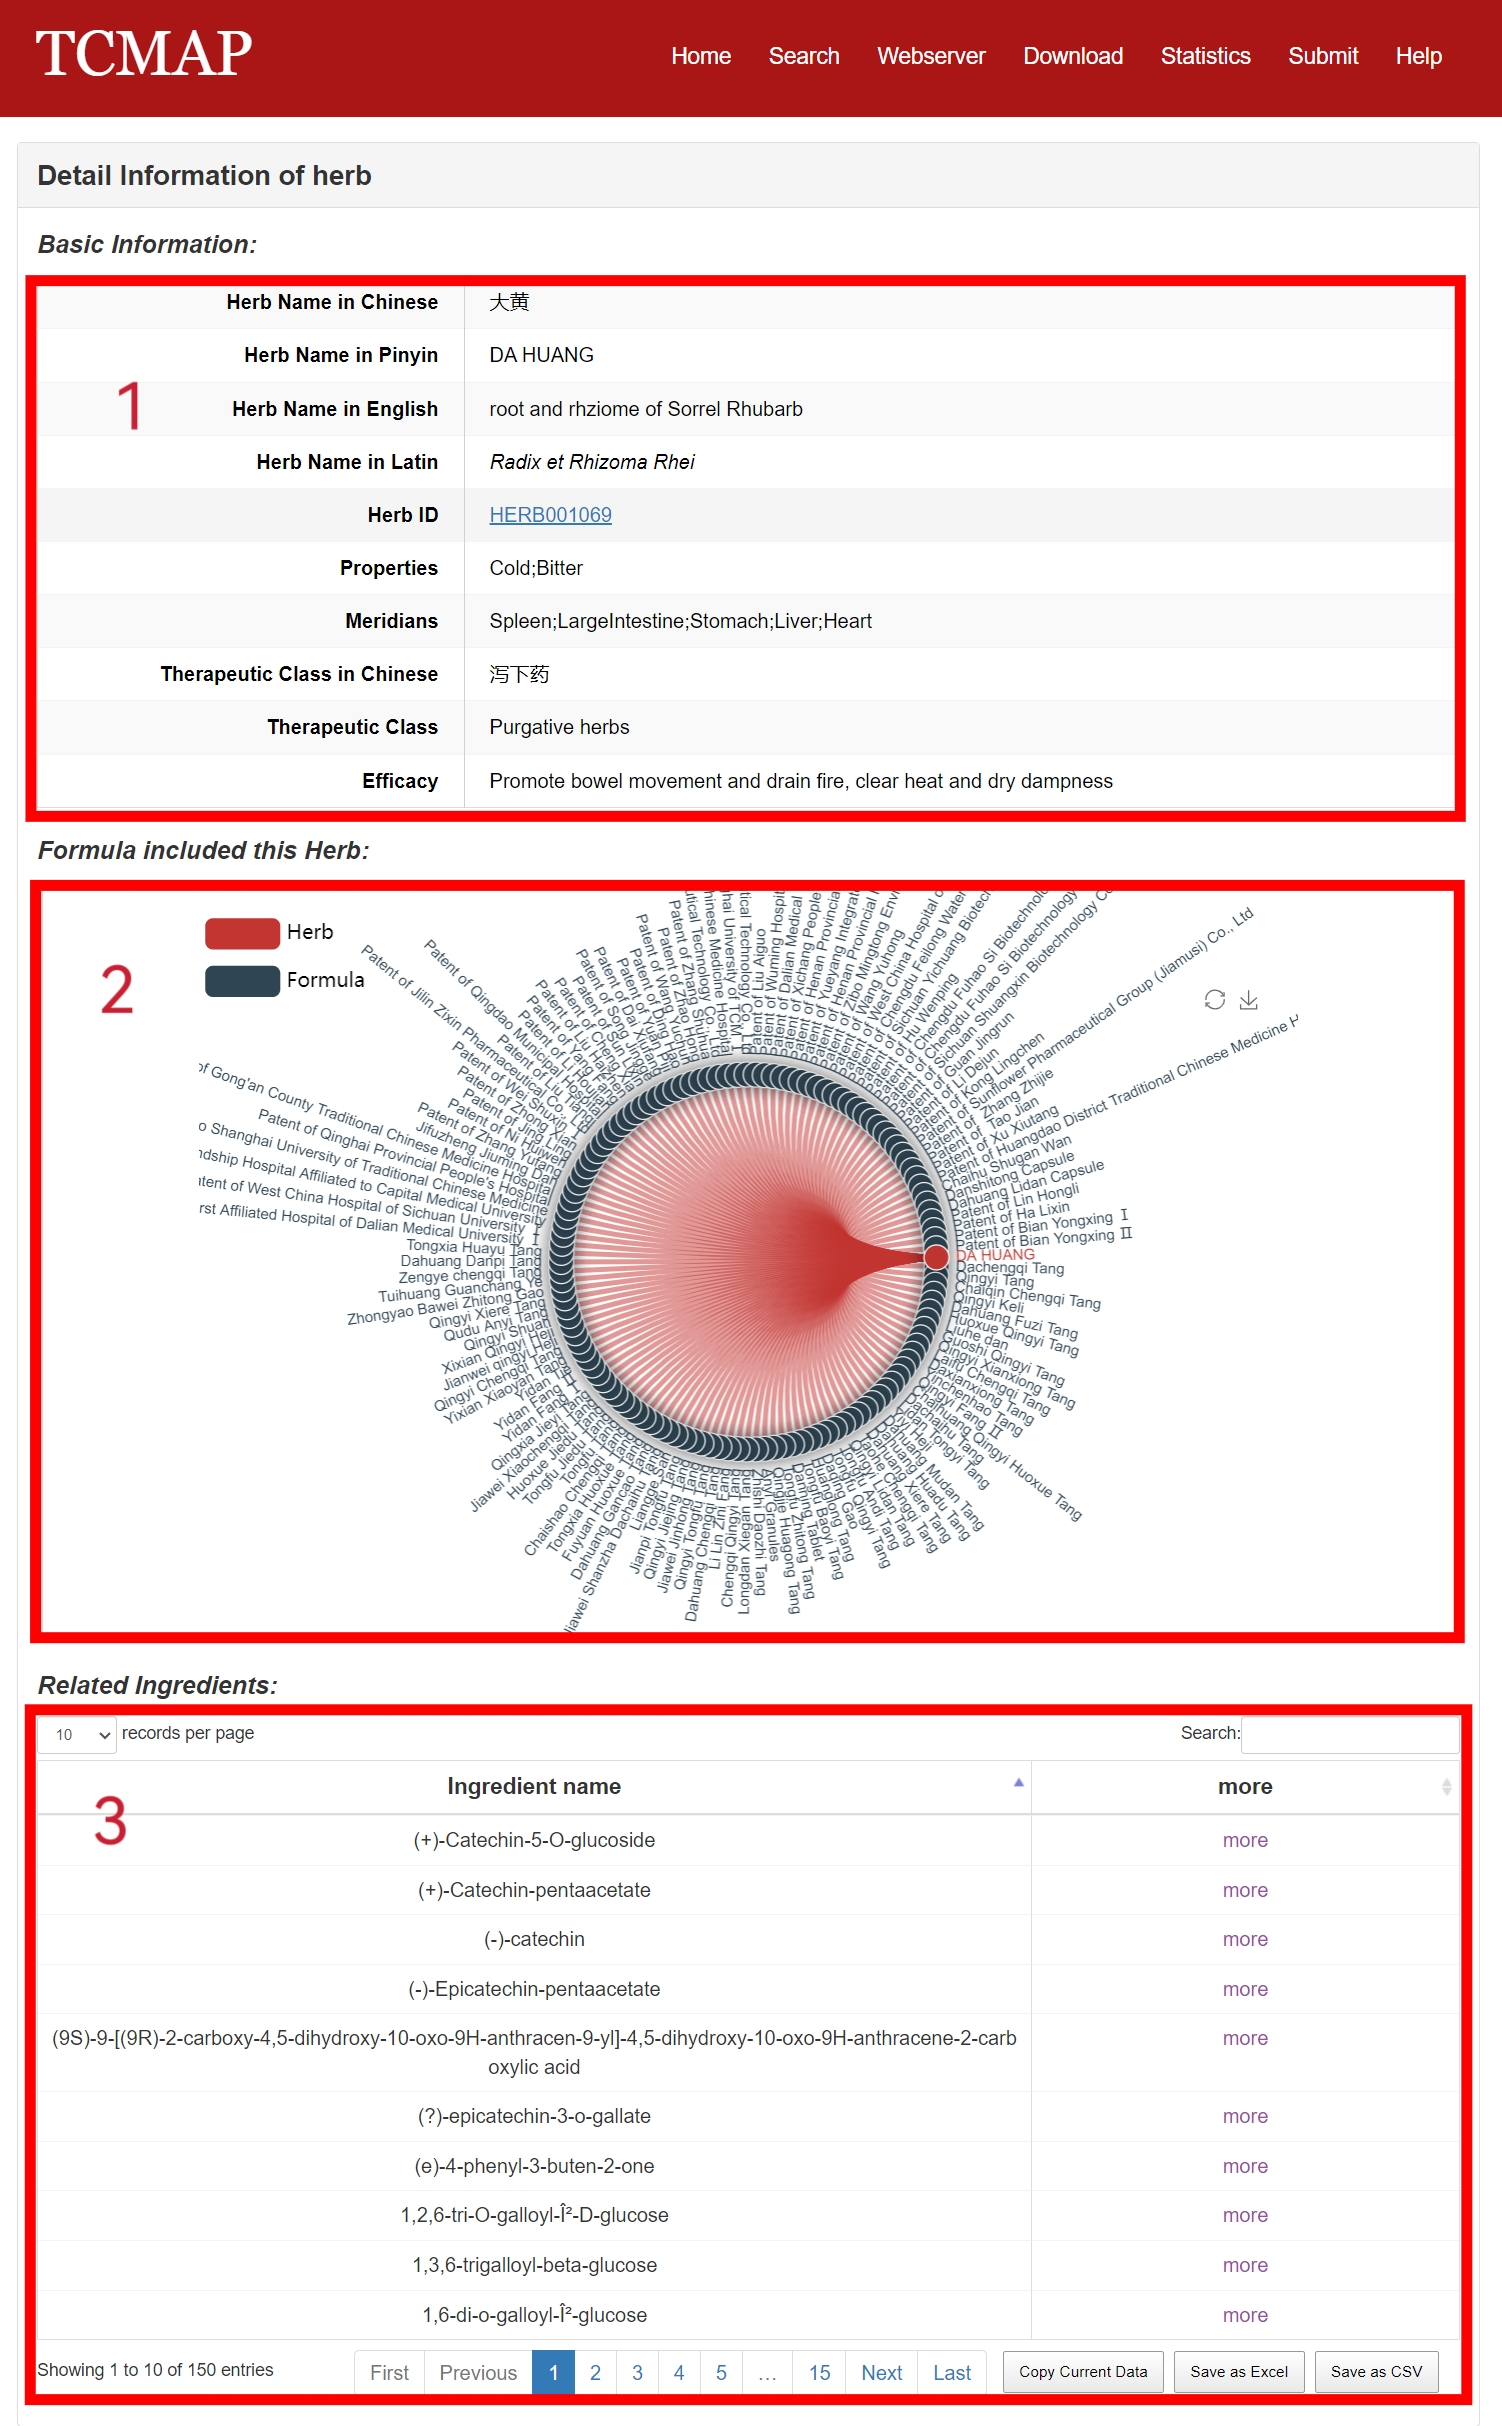
Fig 4-3. Detail page of Herb
For user convenience, TCMAP launches a webserver for Formula Similarity Analysis (FS) and Synergistic Herbal Identification (SH), where formula similarity analysis is based on herbs, metabolites and gene targets, and synergistic herbal identification is divided into metabolite-based and gene target-based.It is worth mentioning that in the metabolite-based formula similarity analysis module and the gene target-based formula similarity analysis module, the metabolites and targets that appeared in the prescriptions exceeding the threshold (80%) were eliminated, and the feature values with high discrimination were retained.
First, in the herb-based formula similarity analysis module, TCMAP uses the formula similarity (FS) score to quantify the similarity between the query formula q and the literature formula i, which is calculated by the overlap coefficient:
\[ \mathrm{FS}(q,i) = \frac{\lvert L_q \cap L_i\rvert} {\min\bigl(\lvert L_q\rvert,\;\lvert L_i\rvert\bigr)} \]
where Lq is the herb list of queried formula q and Li is the herb list of documented formula i.
Second, in the metabolite-based formula similarity analysis module and the metabolite-based synergistic herbal identification module, TCMAP uses the formula similarity (FS) score to quantify the similarity between the query formula q and the literature formula i, and uses the synergistic herbal (SH) score to quantify the similarity between the query herbal metabolite q and the literature herbal metabolite i, which is calculated by the Tanimoto coefficient:
\[ \mathrm{FS}_{\rm metabolite}(q,i),{SH}_{\rm metabolite}(q,i) = \frac{\lvert L_q \cap L_i\rvert} {\lvert L_q\rvert + \lvert L_i\rvert \;-\;\lvert L_q \cap L_i\rvert} \]
Where Lq is the metabolite list of the query herbal metabolite q or formula metabolite q, and Li is the metabolite list of the literature herbal metabolite i or formula metabolite i.
Then, in the gene target-based formula similarity analysis module and the gene target-based synergistic herbal identification module, TCMAP quantifies the similarity between the query herbal gene target q and the literature herbal gene target i using the synergistic herbal (SH) score, and quantifies the similarity between the query formula gene target q and the literature formula gene target i using the formula similarity (FS) score, which is calculated by the Jaccard coefficient:
\[ \mathrm{FS}_{\rm gene}(q,i),{SH}_{\rm gene}(q,i) = \frac{\lvert L_q \cap L_i\rvert} {\lvert L_q \cup L_i\rvert} \]
Where Lq is the gene list of the query herbal gene target q or formula gene target q, and Li is the gene list of the literature herbal gene target q or formula gene target i.
Lastly, we estimated the significance of the similarity between the queried formula or herb and the documented formula or herb with Fisher's exact test.
The Webserver page and result is displayed in the following Fig 5-1.
1.Select the type of webserver, including Formula Similarity Analysis (FS) and Synergistic Herbal Identification (SH).
2.Take formula similarity analysis as an example.Filling out the herb list of the queried formula in the query window.
3.Setting he threshold of the P-value (Fisher's exact test): you can use specific threshold such as 0.05 or 0.01.
4.Setting the type of herb name fill in the query window: you can use herb Pinyin name, Chinese name, English name or Herb id.
5.The result page provides an embedded bubble chart web tool to display the results: The size of each bubble represents the FS score, and the color of the bubble represents the significance of the FS score.
6.Download the bubble chart (PDF).
7.Download the result table (TXT).
8.Enrichment analysis results table.
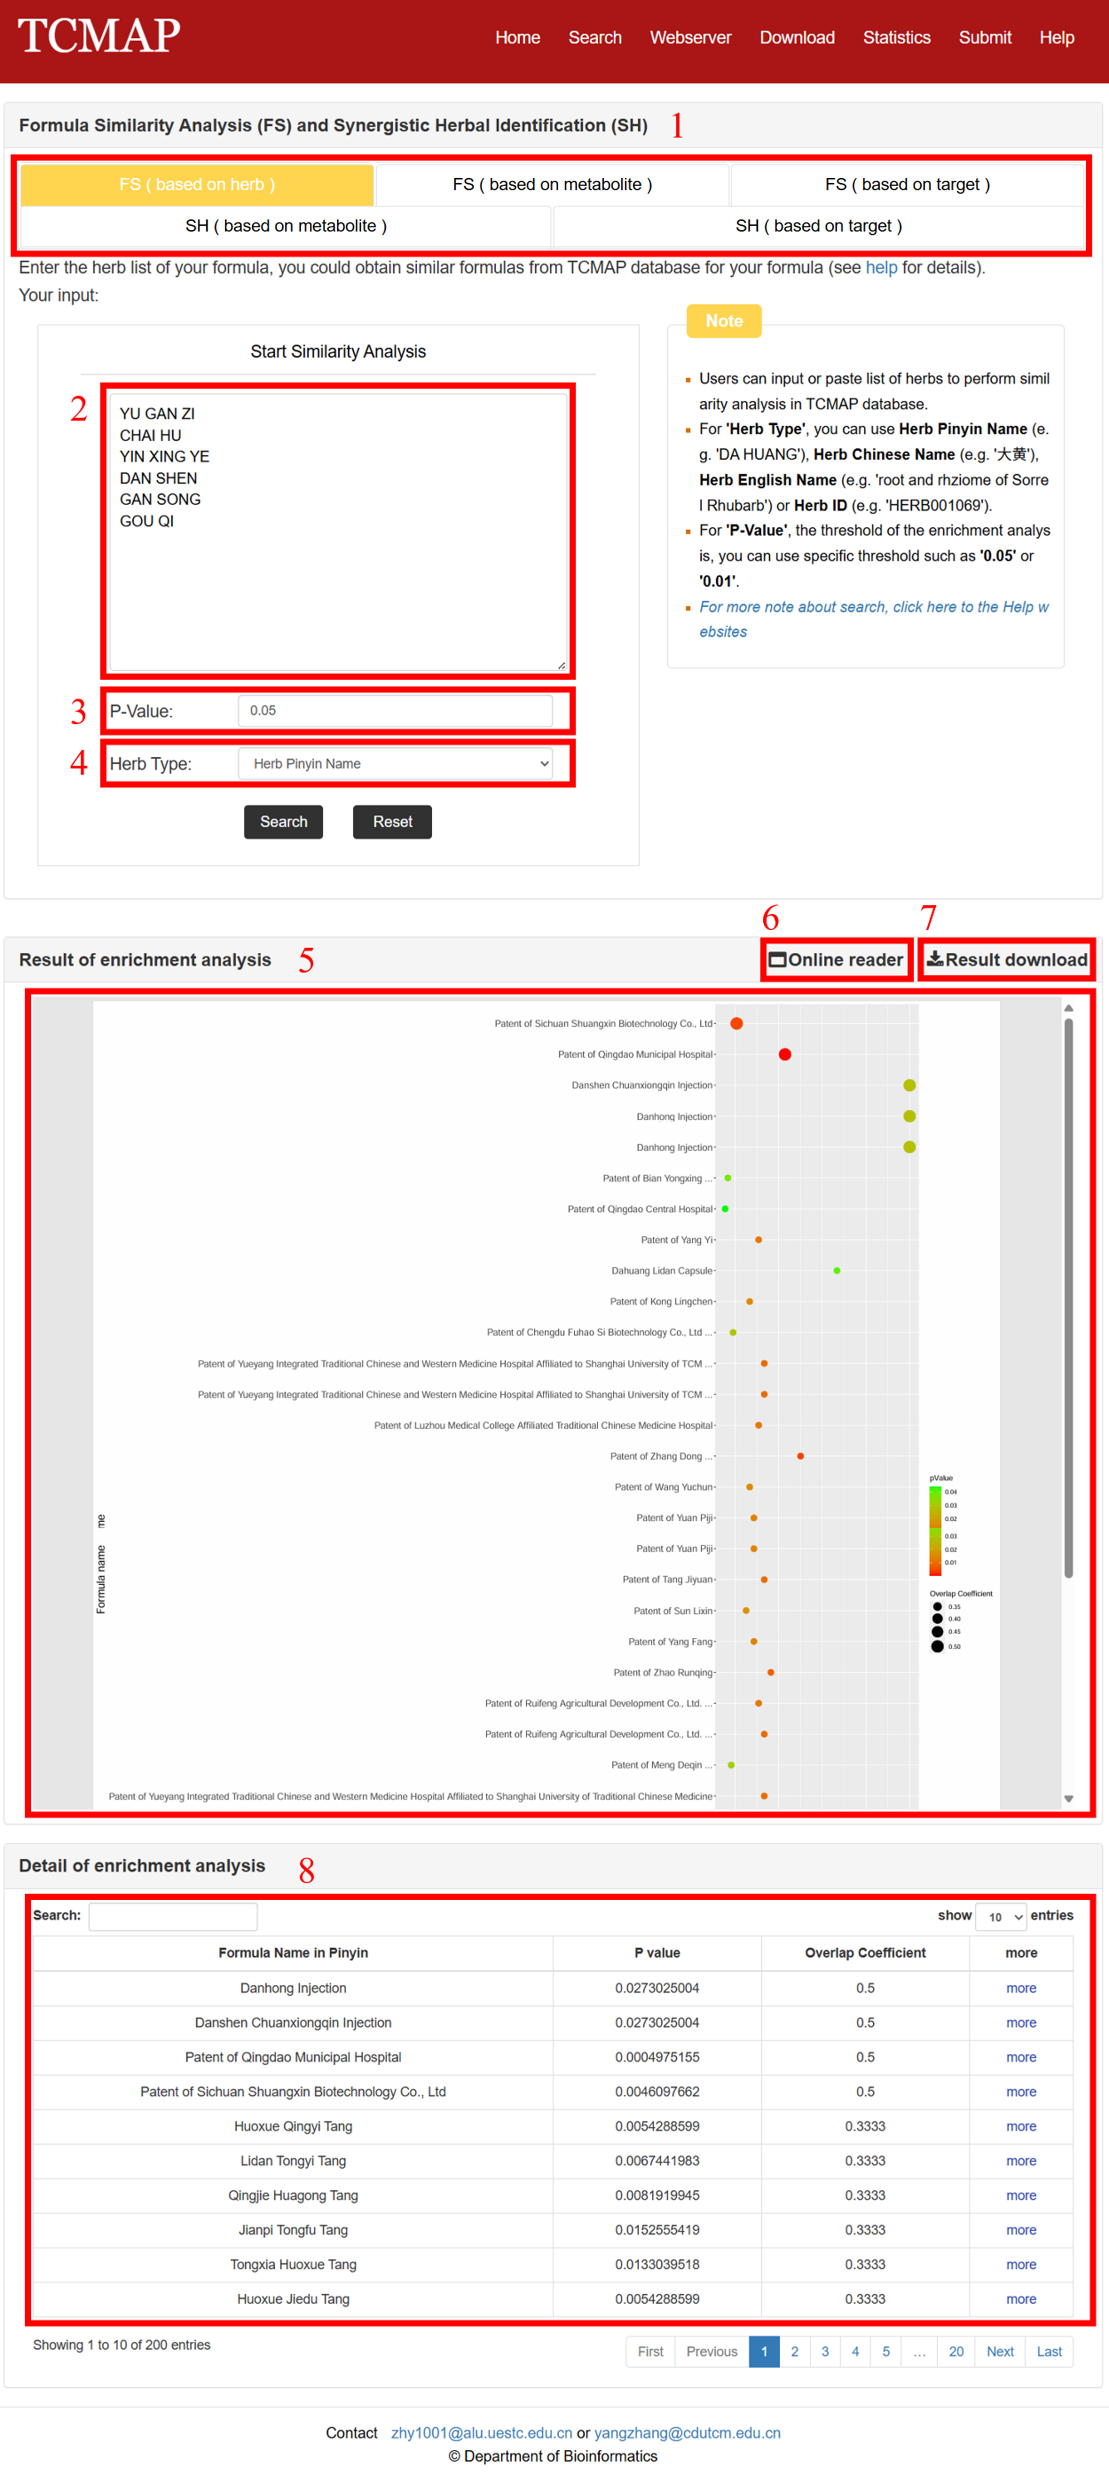
Fig 5-1. Webserver page and result of the analysis
The TCMAP Network Tool allows users to visualize the multi-level relationships between Traditional Chinese Medicine (TCM) Formulas, Herbs, Chemical Metabolites, and Biological Targets. This tool helps researchers explore the hierarchical connections within TCM systems.
The Network page and result is displayed in the following Fig 6-1:
1. Formula Selector: A dropdown menu where you choose the herbal formula you want to explore.
2. Entity Filters & Submit: Entity buttons (including herbs, metabolites, targets) are used to select the layer of interest in the network diagram, plus the black “Submit” button to redraw the network.
3. Network Display: The main force-directed graph area showing nodes (formula, herbs, metabolites, targets) and their connections.
4. View Controls: Options to return to the global overview, export the current graph as SVG, and enable/disable the force-simulation layout.
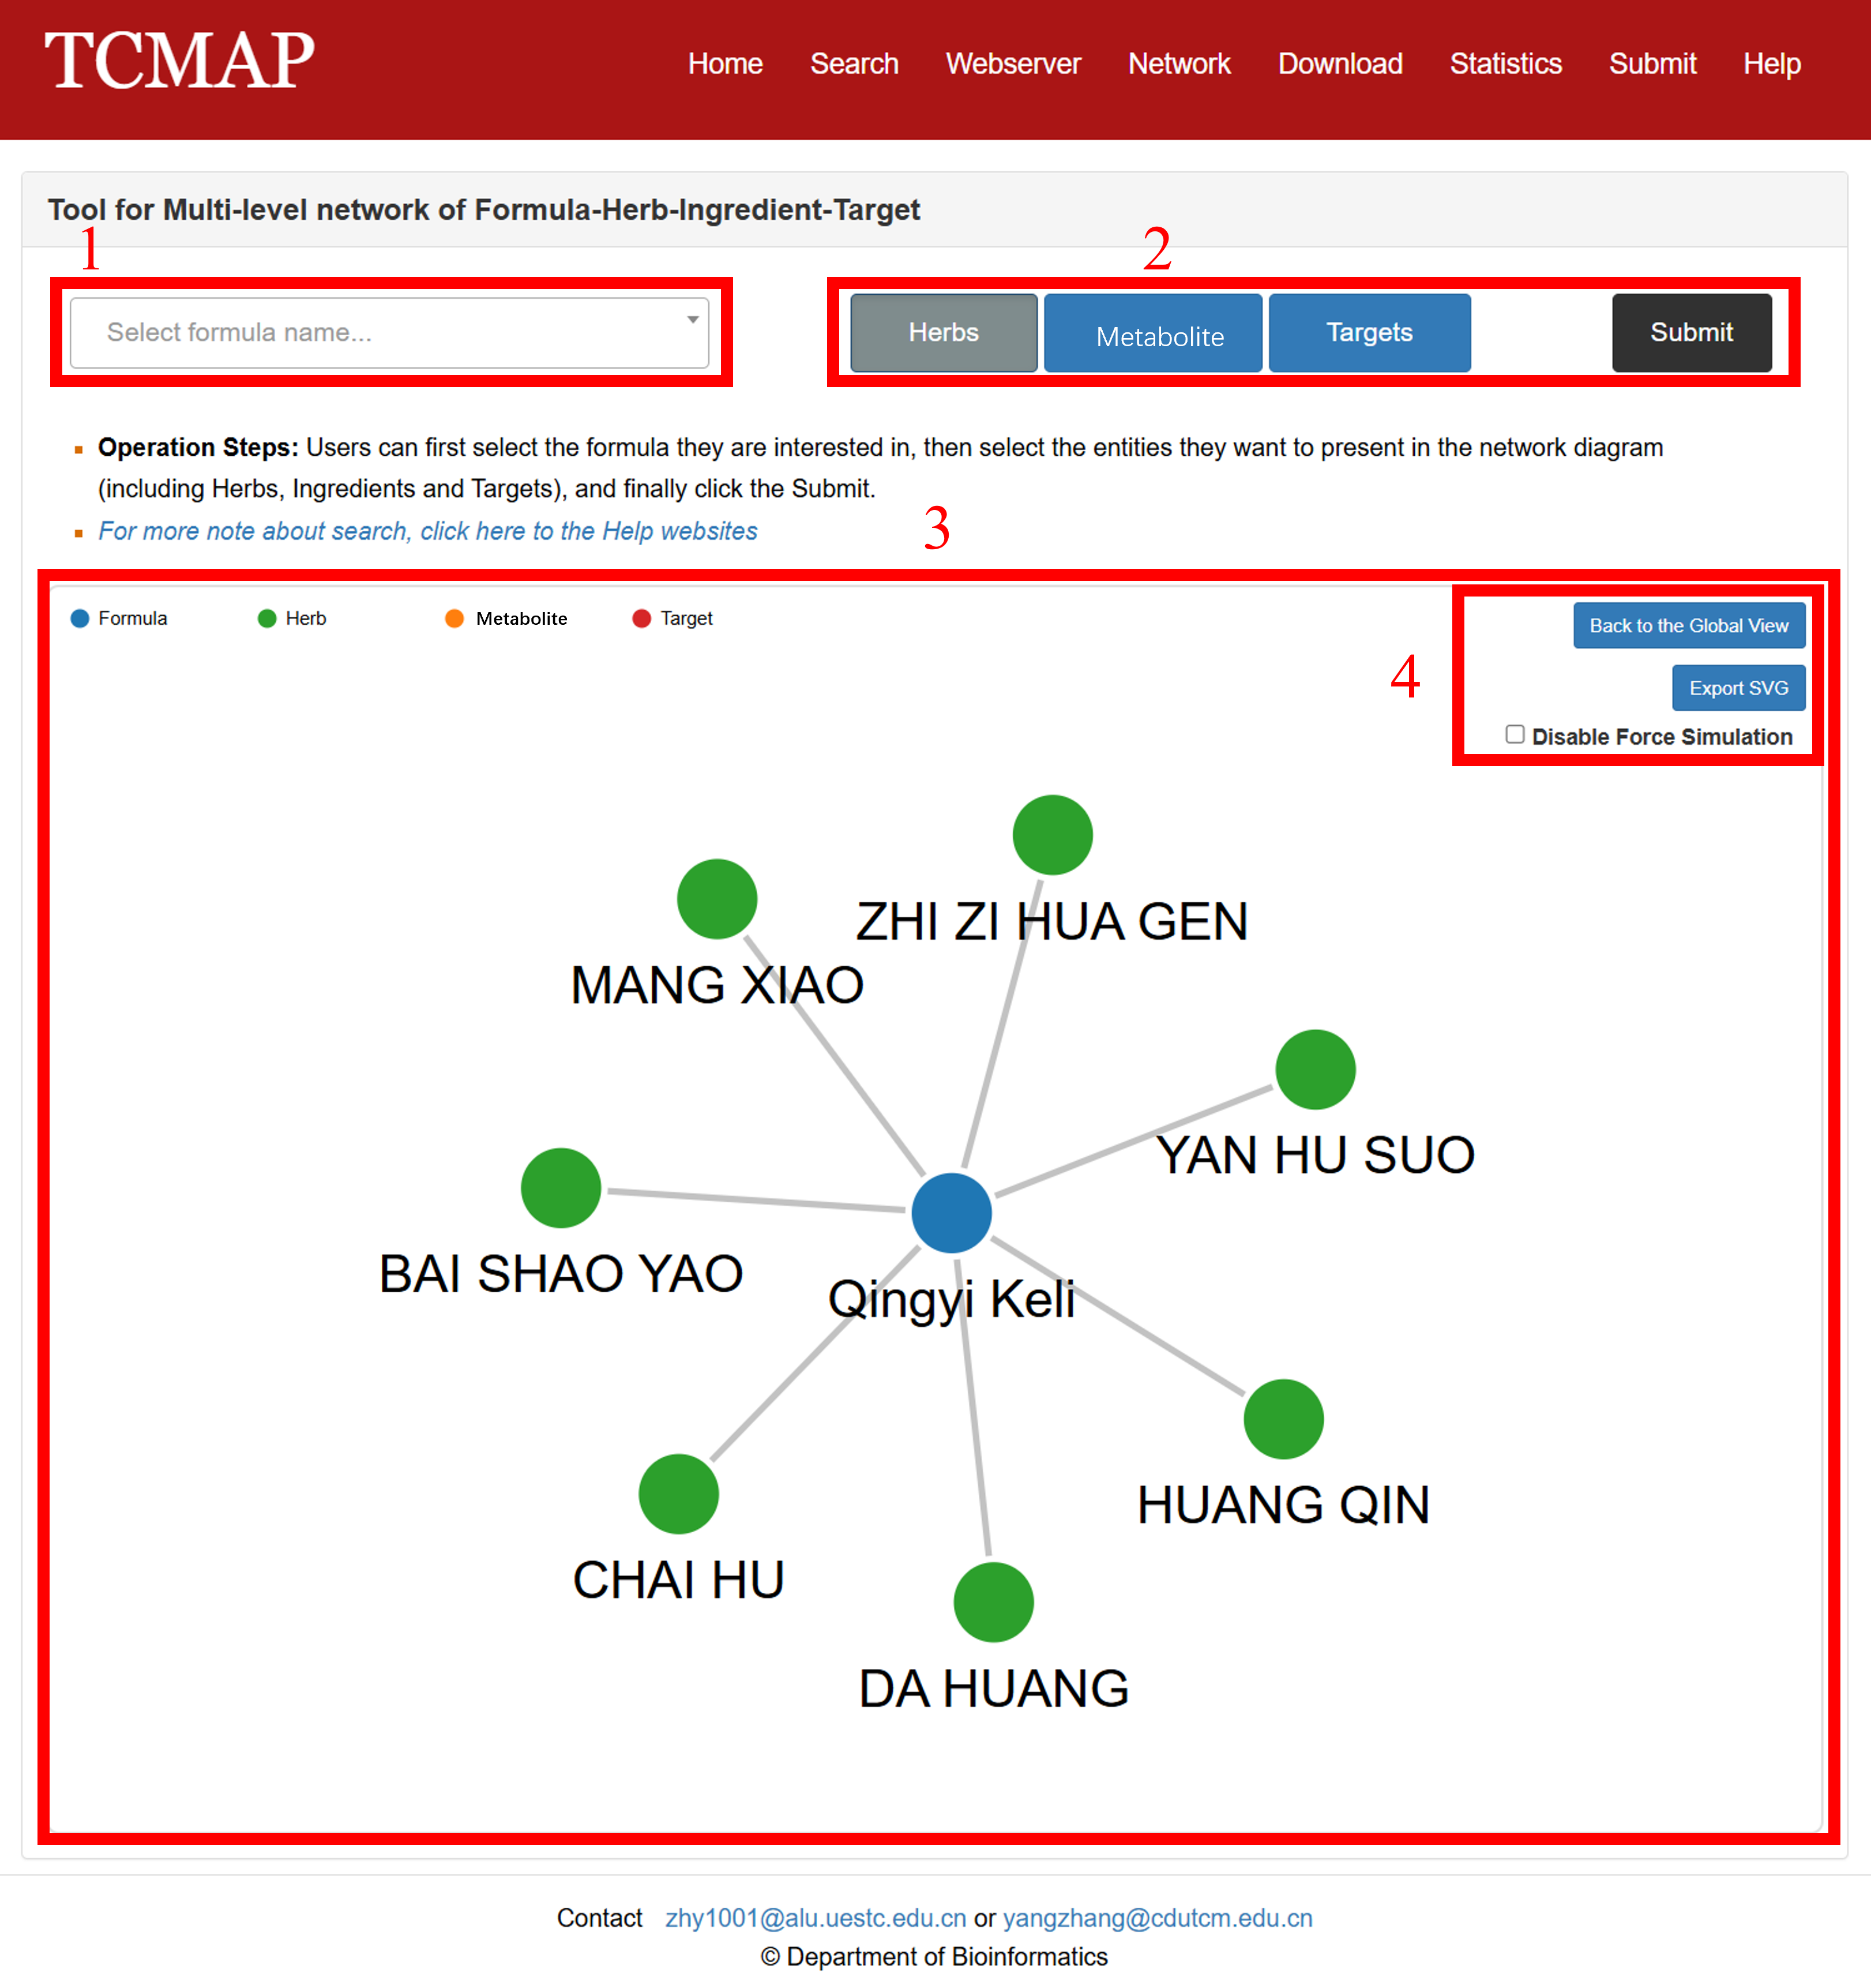
Fig 6-1. Network page