
Overview:
Our database is dedicated to providing single-cell transcriptomic data related to cancer treatment, focusing on the cellular changes before and after therapy. The current version of the database compiles data from 1,497 patient samples across 63 datasets, encompassing over 2.5 million cells and 144 cell types. These data originate from 11 different tissue types and cover 22 types of cancer.
The homepage is displayed in the following Fig 1-1:
1. Main functions of the database are provided in menu bar form (boxed in red).
2. Introduction and overview for CellResDB.
3. Other databases contributed by our group.
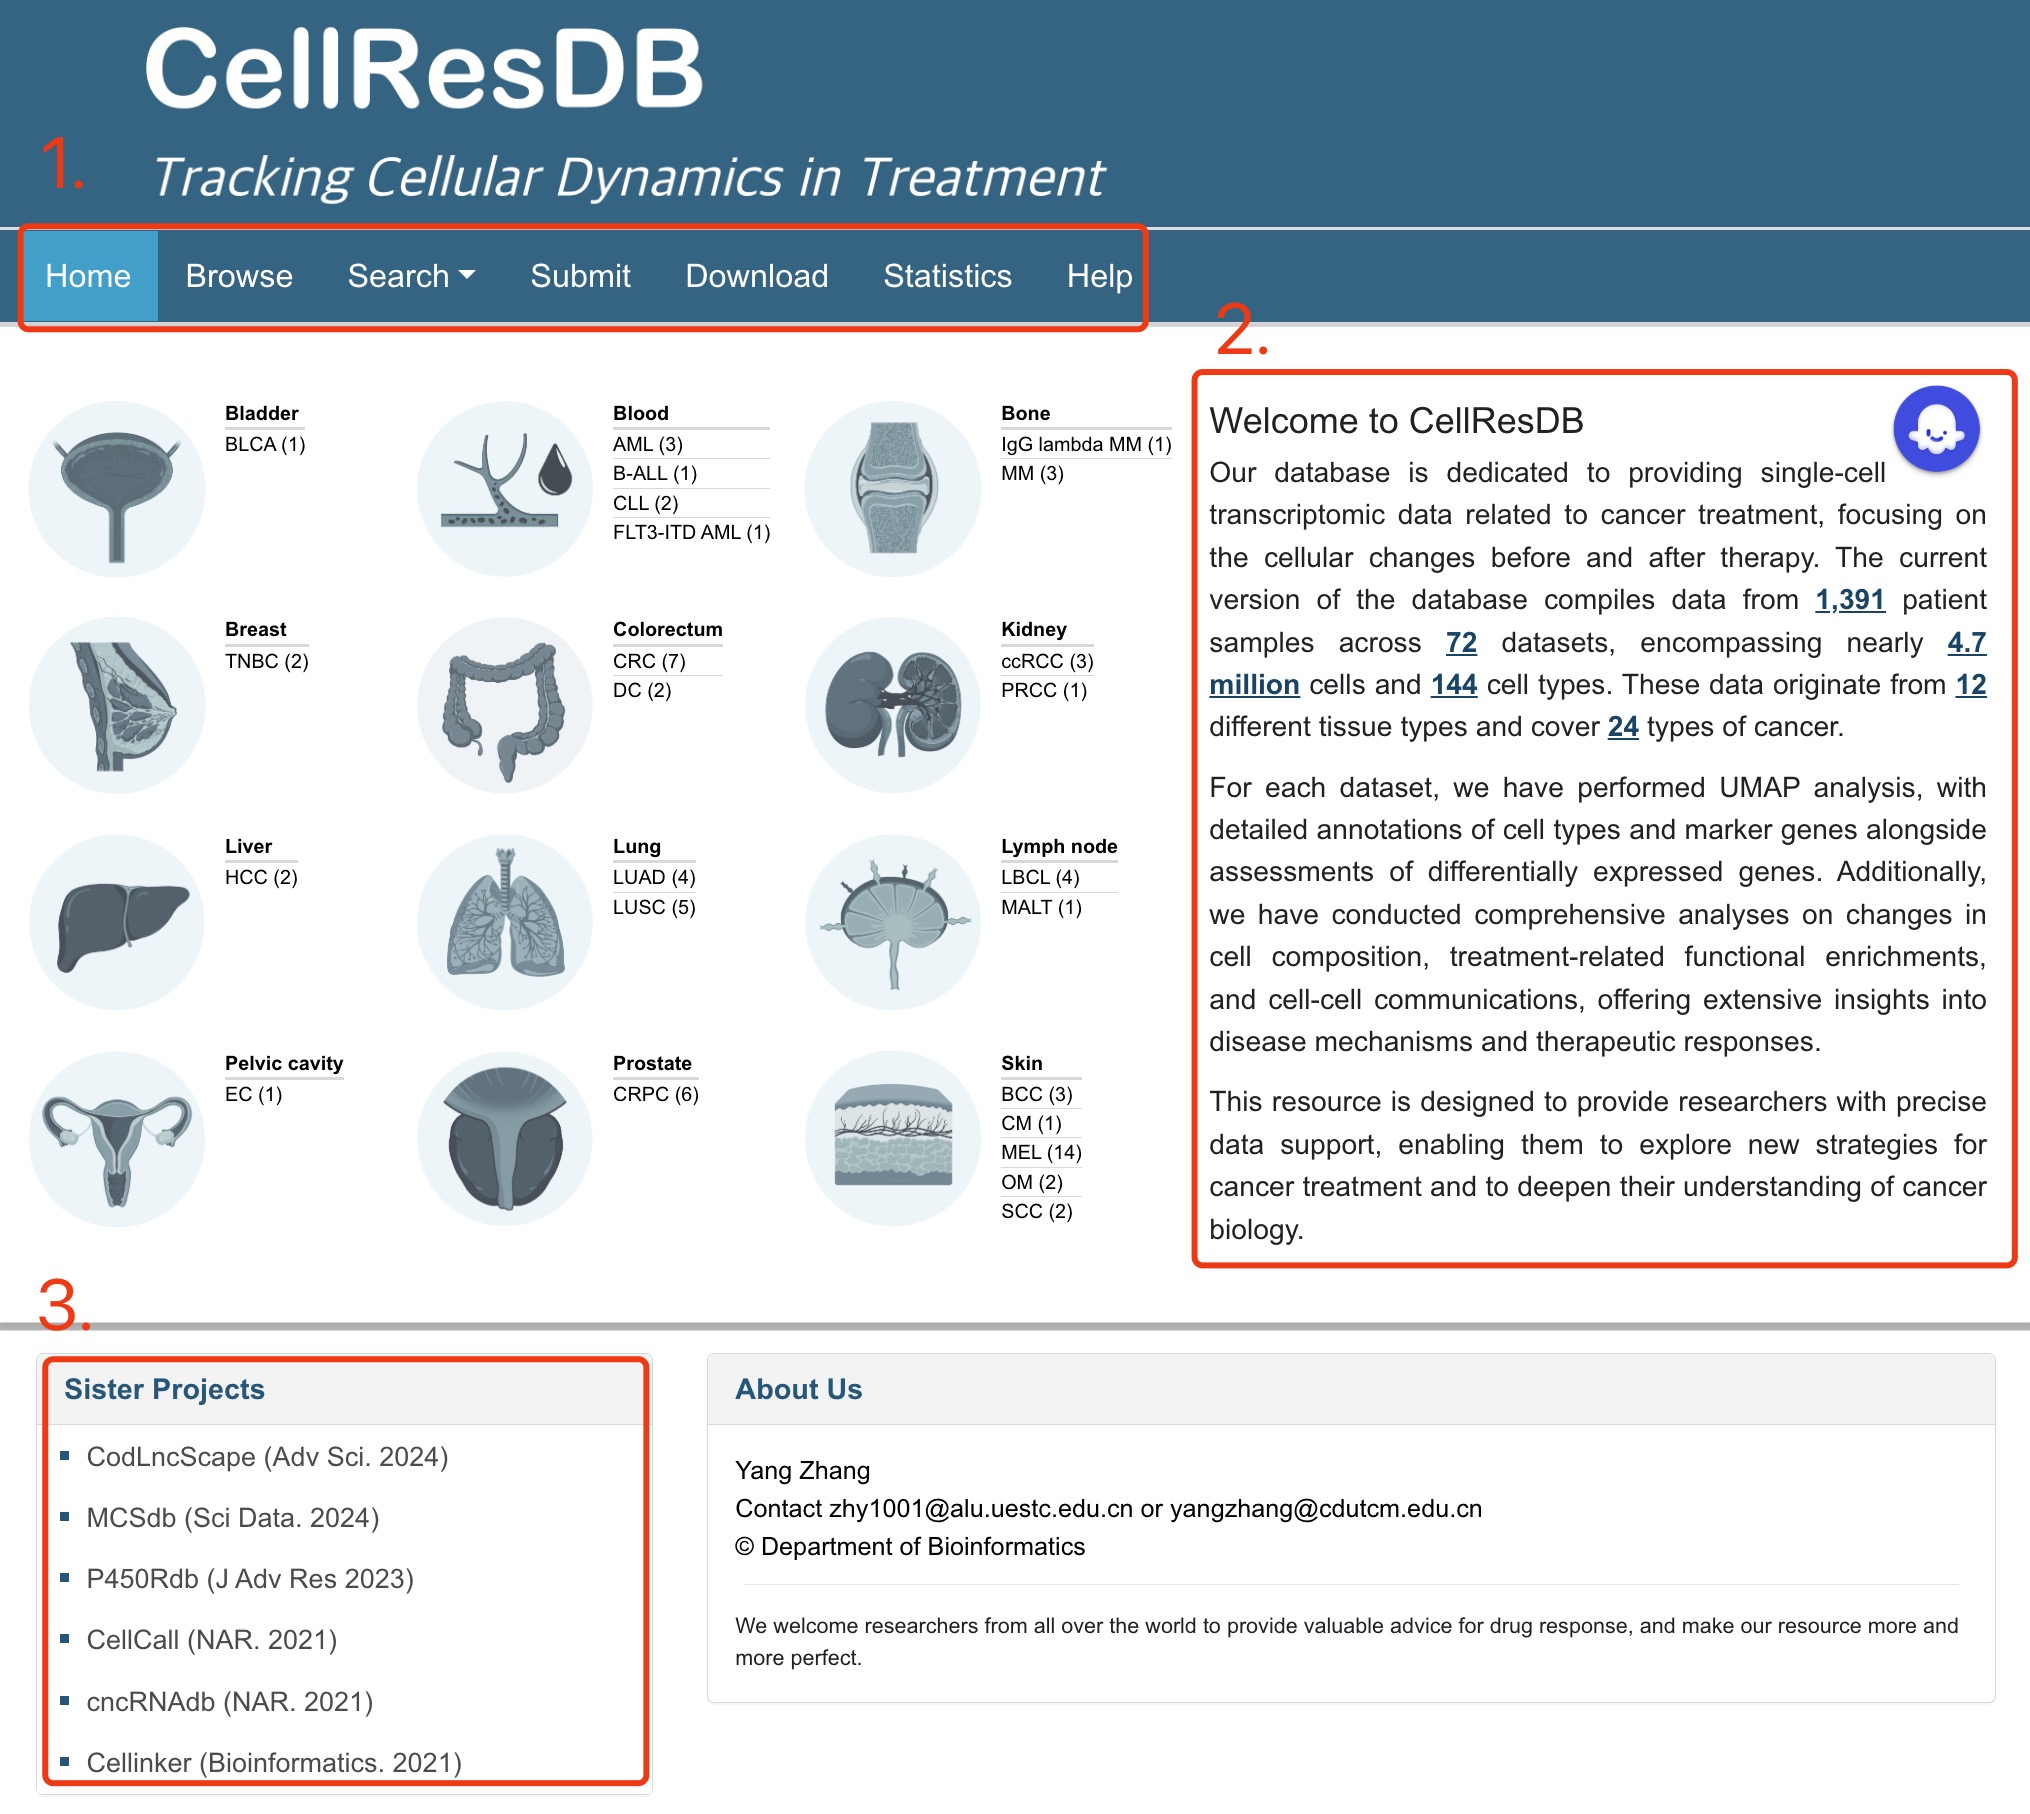
Fig 1-1. Home page
The search page is displayed in Fig 2-1, Fig 2-2 and 2-3:
Search submenu:
1. Hover over the 'Search' button on the navigation bar.
2. A dropdown menu for 'Gene' and 'Cell Search' will automatically appear.
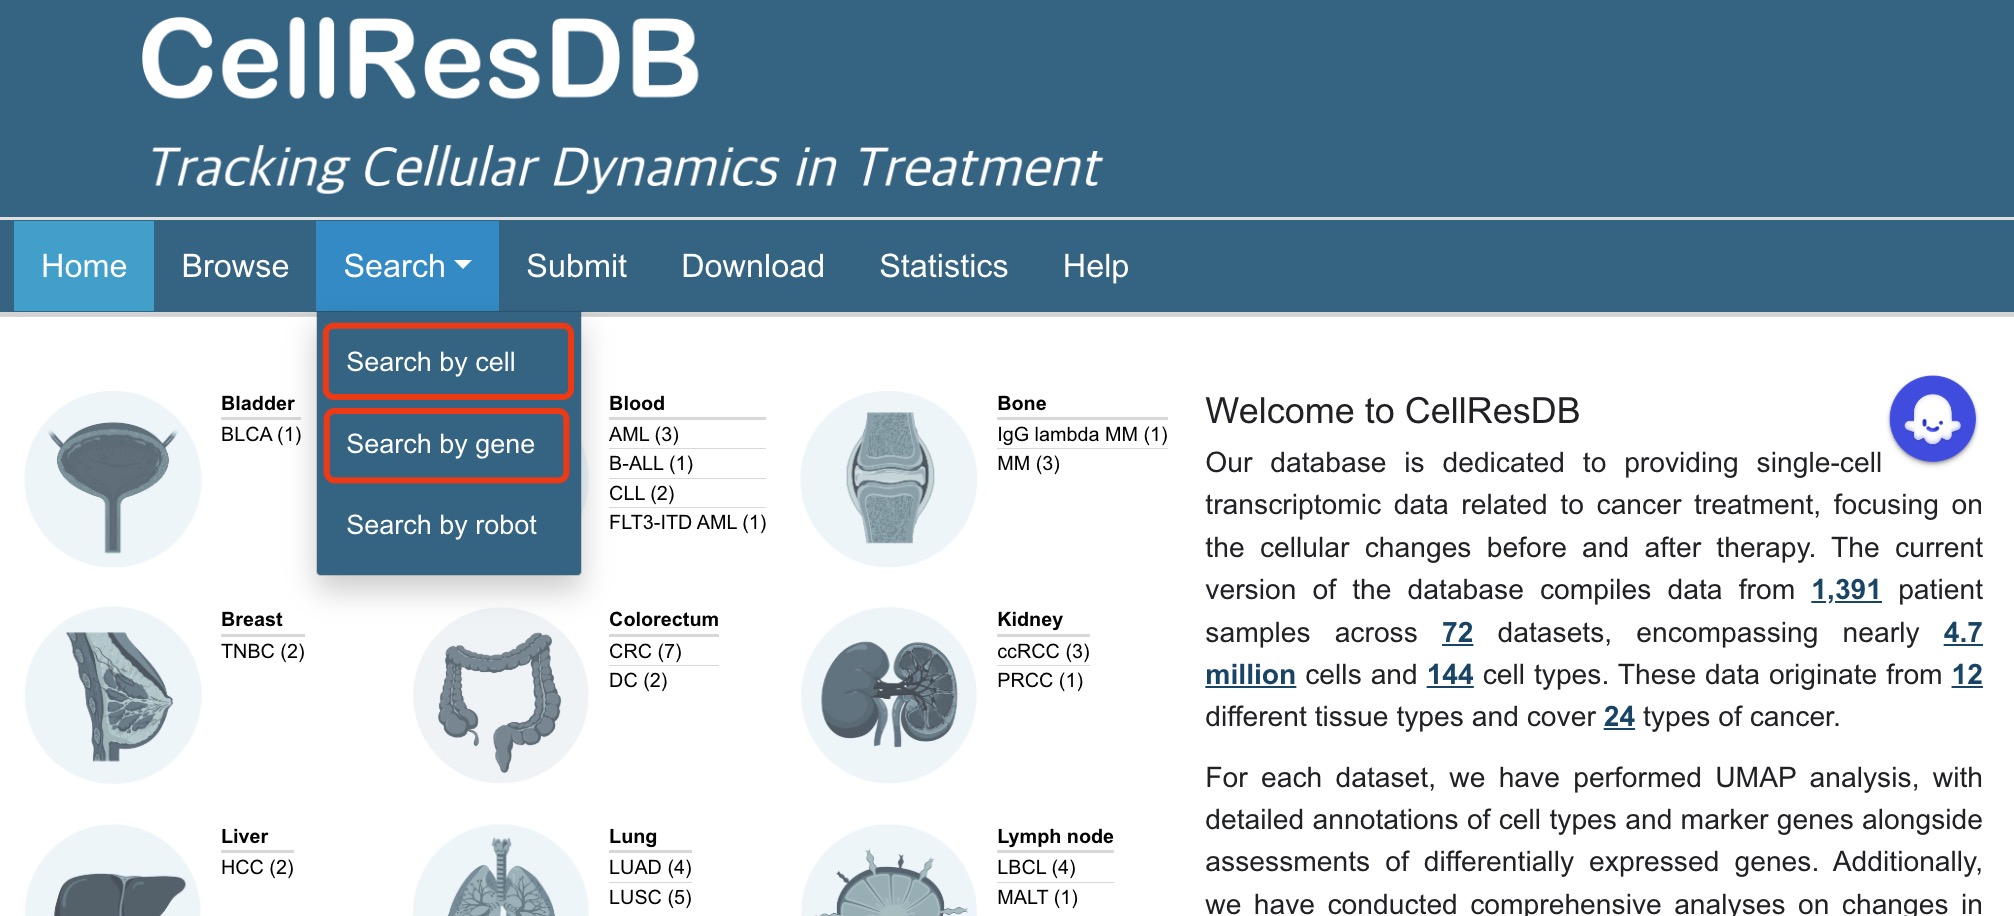
Fig 2-1. Search submenu
Gene search:
1. Select gene search.
2. Input the keyword corresponding to gene of interest and other filter options.
3. Click the submit button.
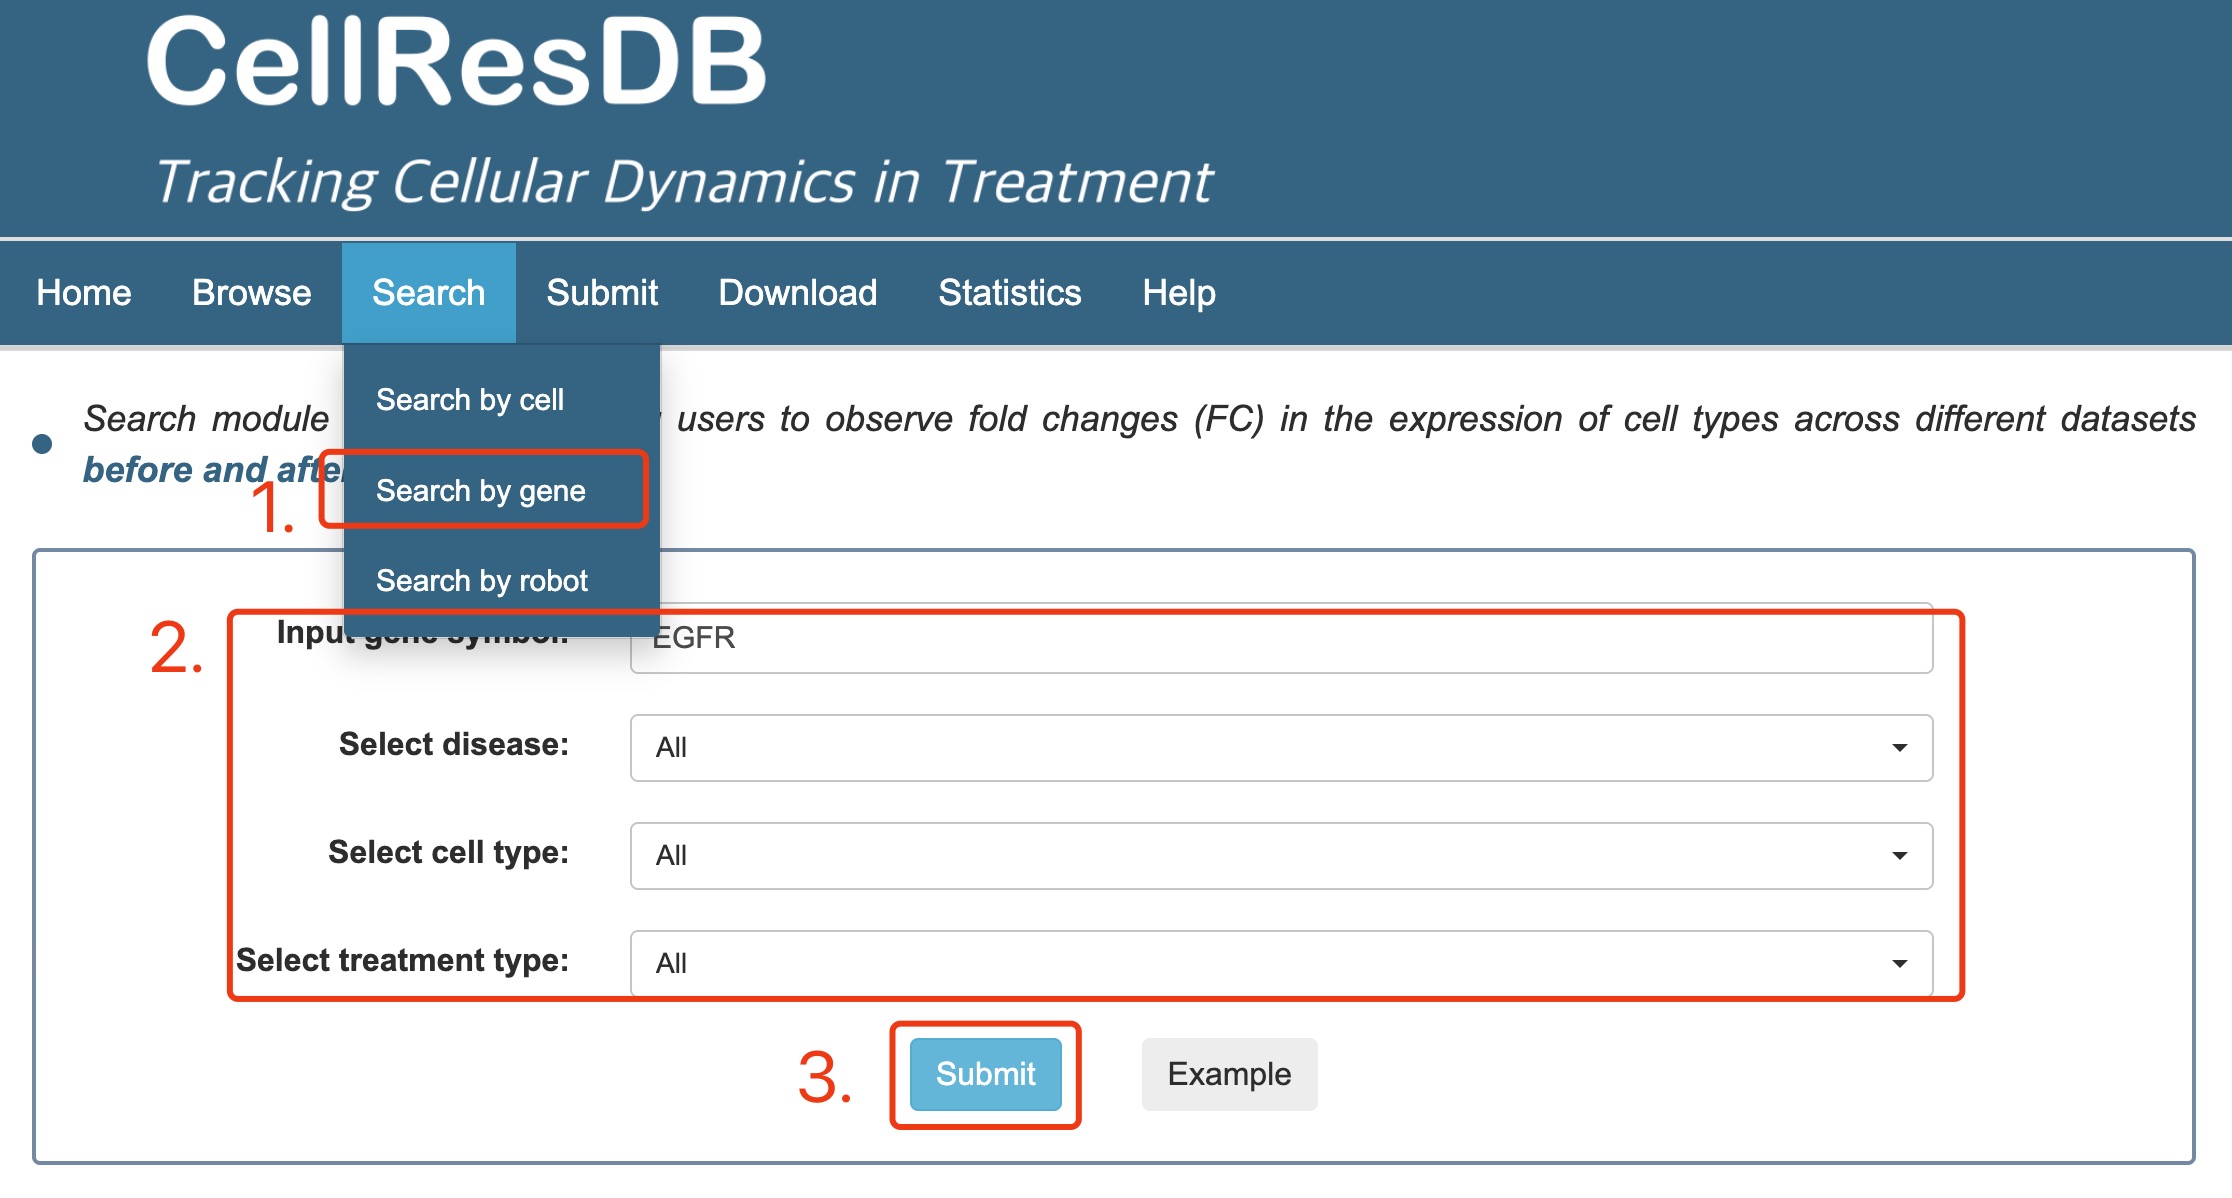
Fig 2-2. Gene search page
Cell search:
1. Select cell search.
2. Select single or multiple cell types of interest and other filter options.
3. Click the submit button.
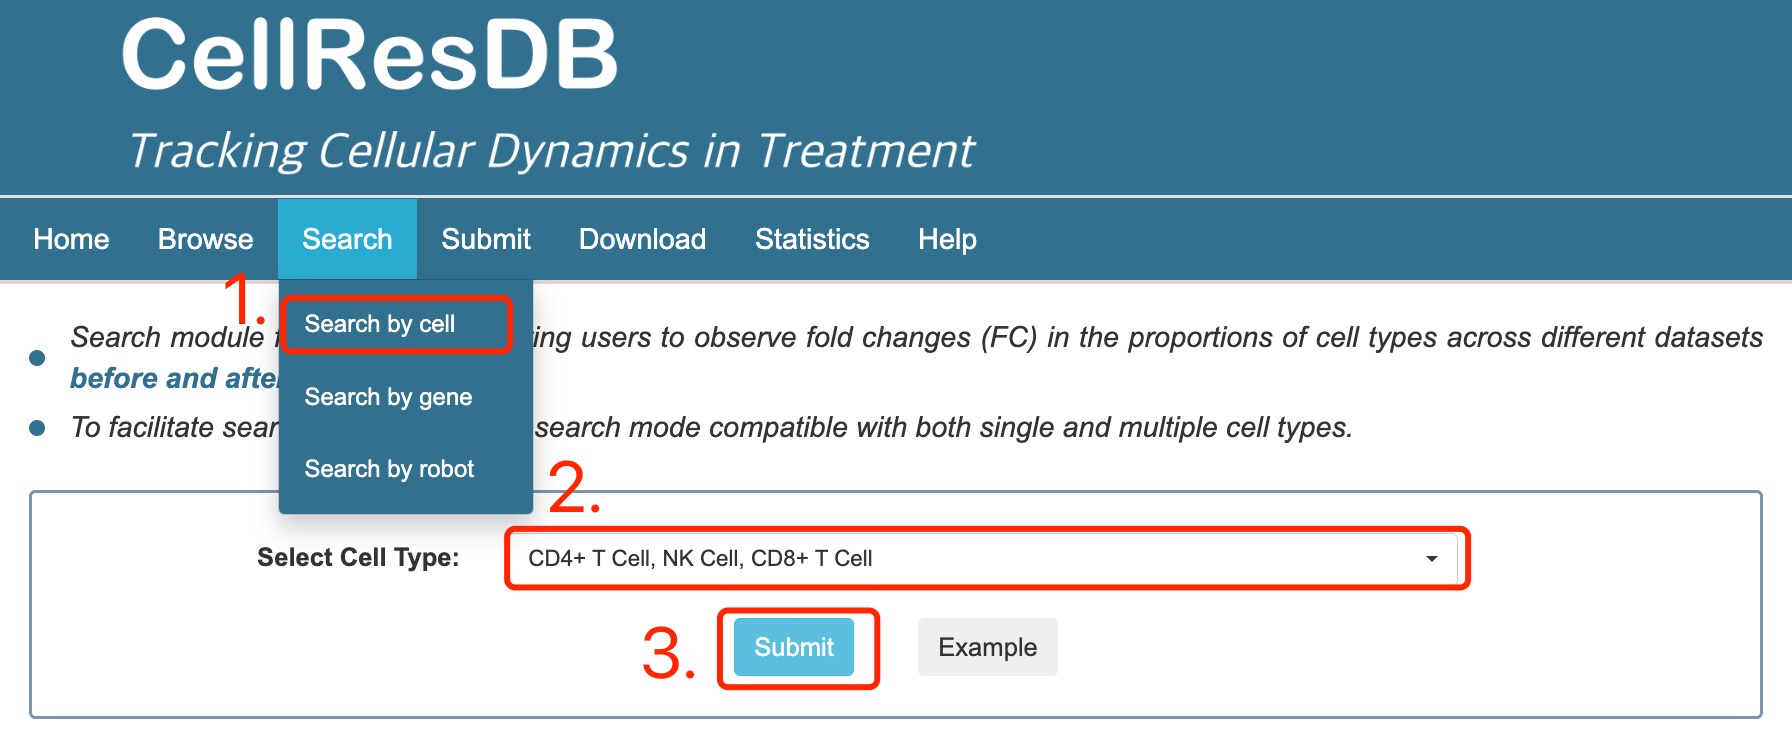
Fig 2-3. Cell search page
Result page of gene search and cell search:
For the result page of gene search and cell search, all entries are listed with basic information including cancer type, fold change and P-value.
Fig 3-1:
1. Explanation of colors in the column of log2FC (log2 foldchange).
2. Fold change is calculated as the expression of a specific gene in the post-treatment group divided by the pre-treatment group.
3. Click the link to Detail page.
4. Summary of search result in heatmap.
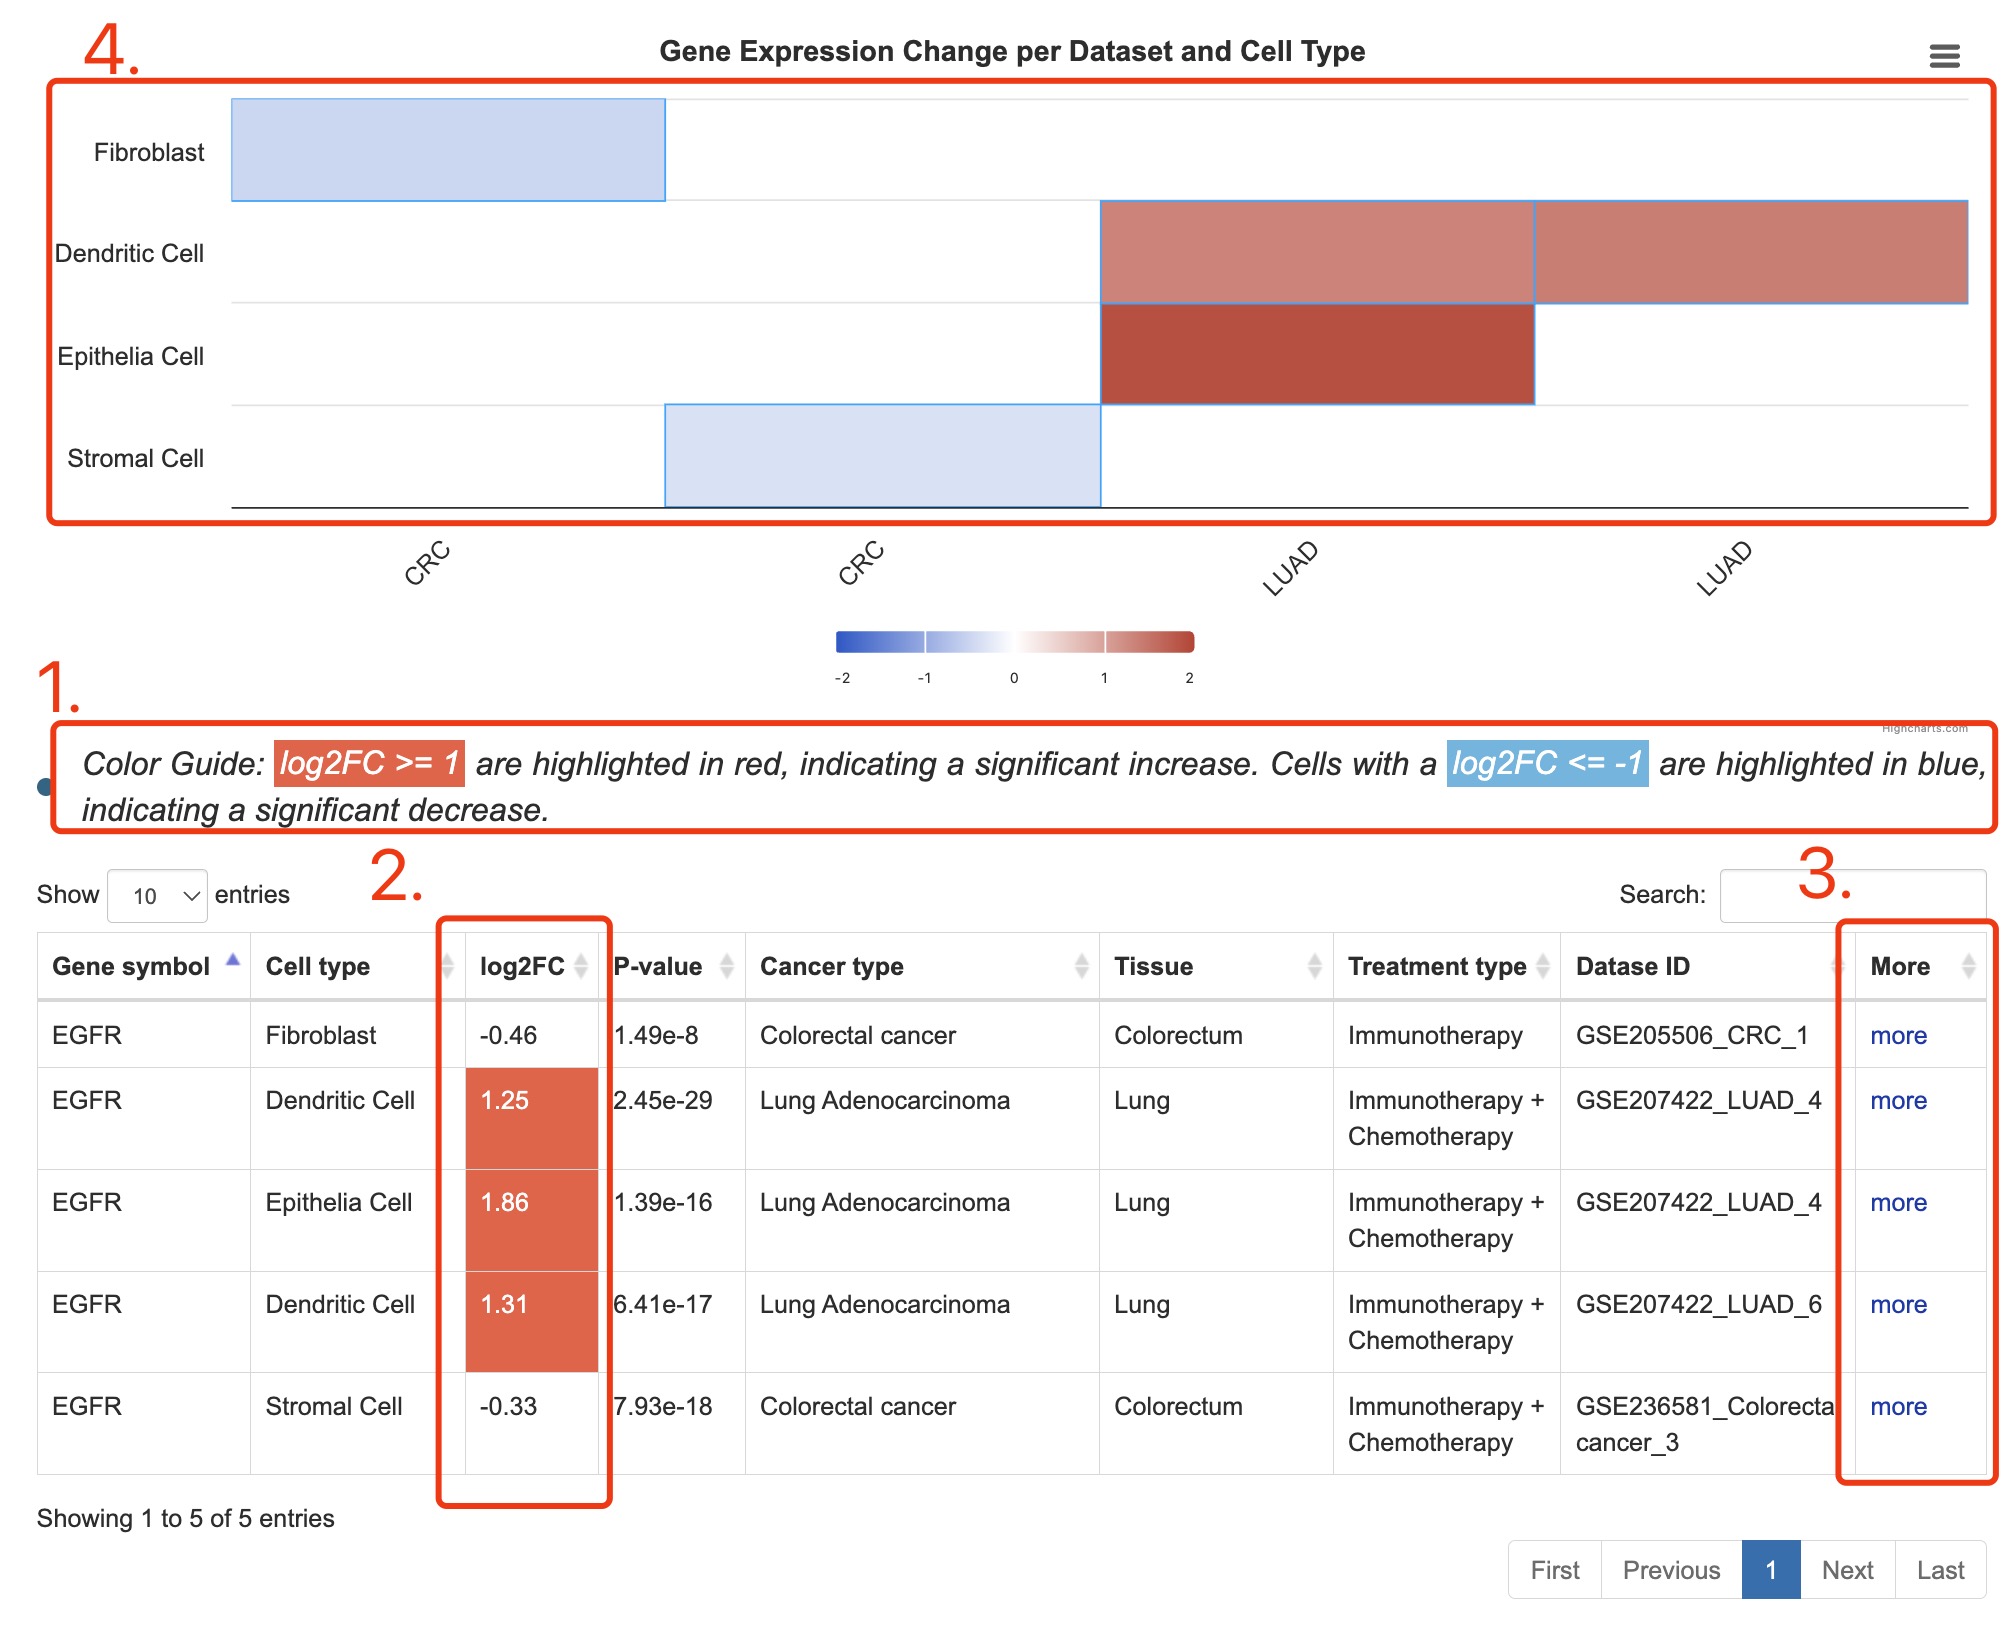
Fig 3-1. Result page of gene search
Fig 3-2:
1. Explanation of colors in the column of log2FC (log2 foldchange).
2. Fold change is calculated as the specific cell type proportion in the post-treatment group divided by the pre-treatment group.
3. Click the link to Detail page.
4. Summary of search result in heatmap.
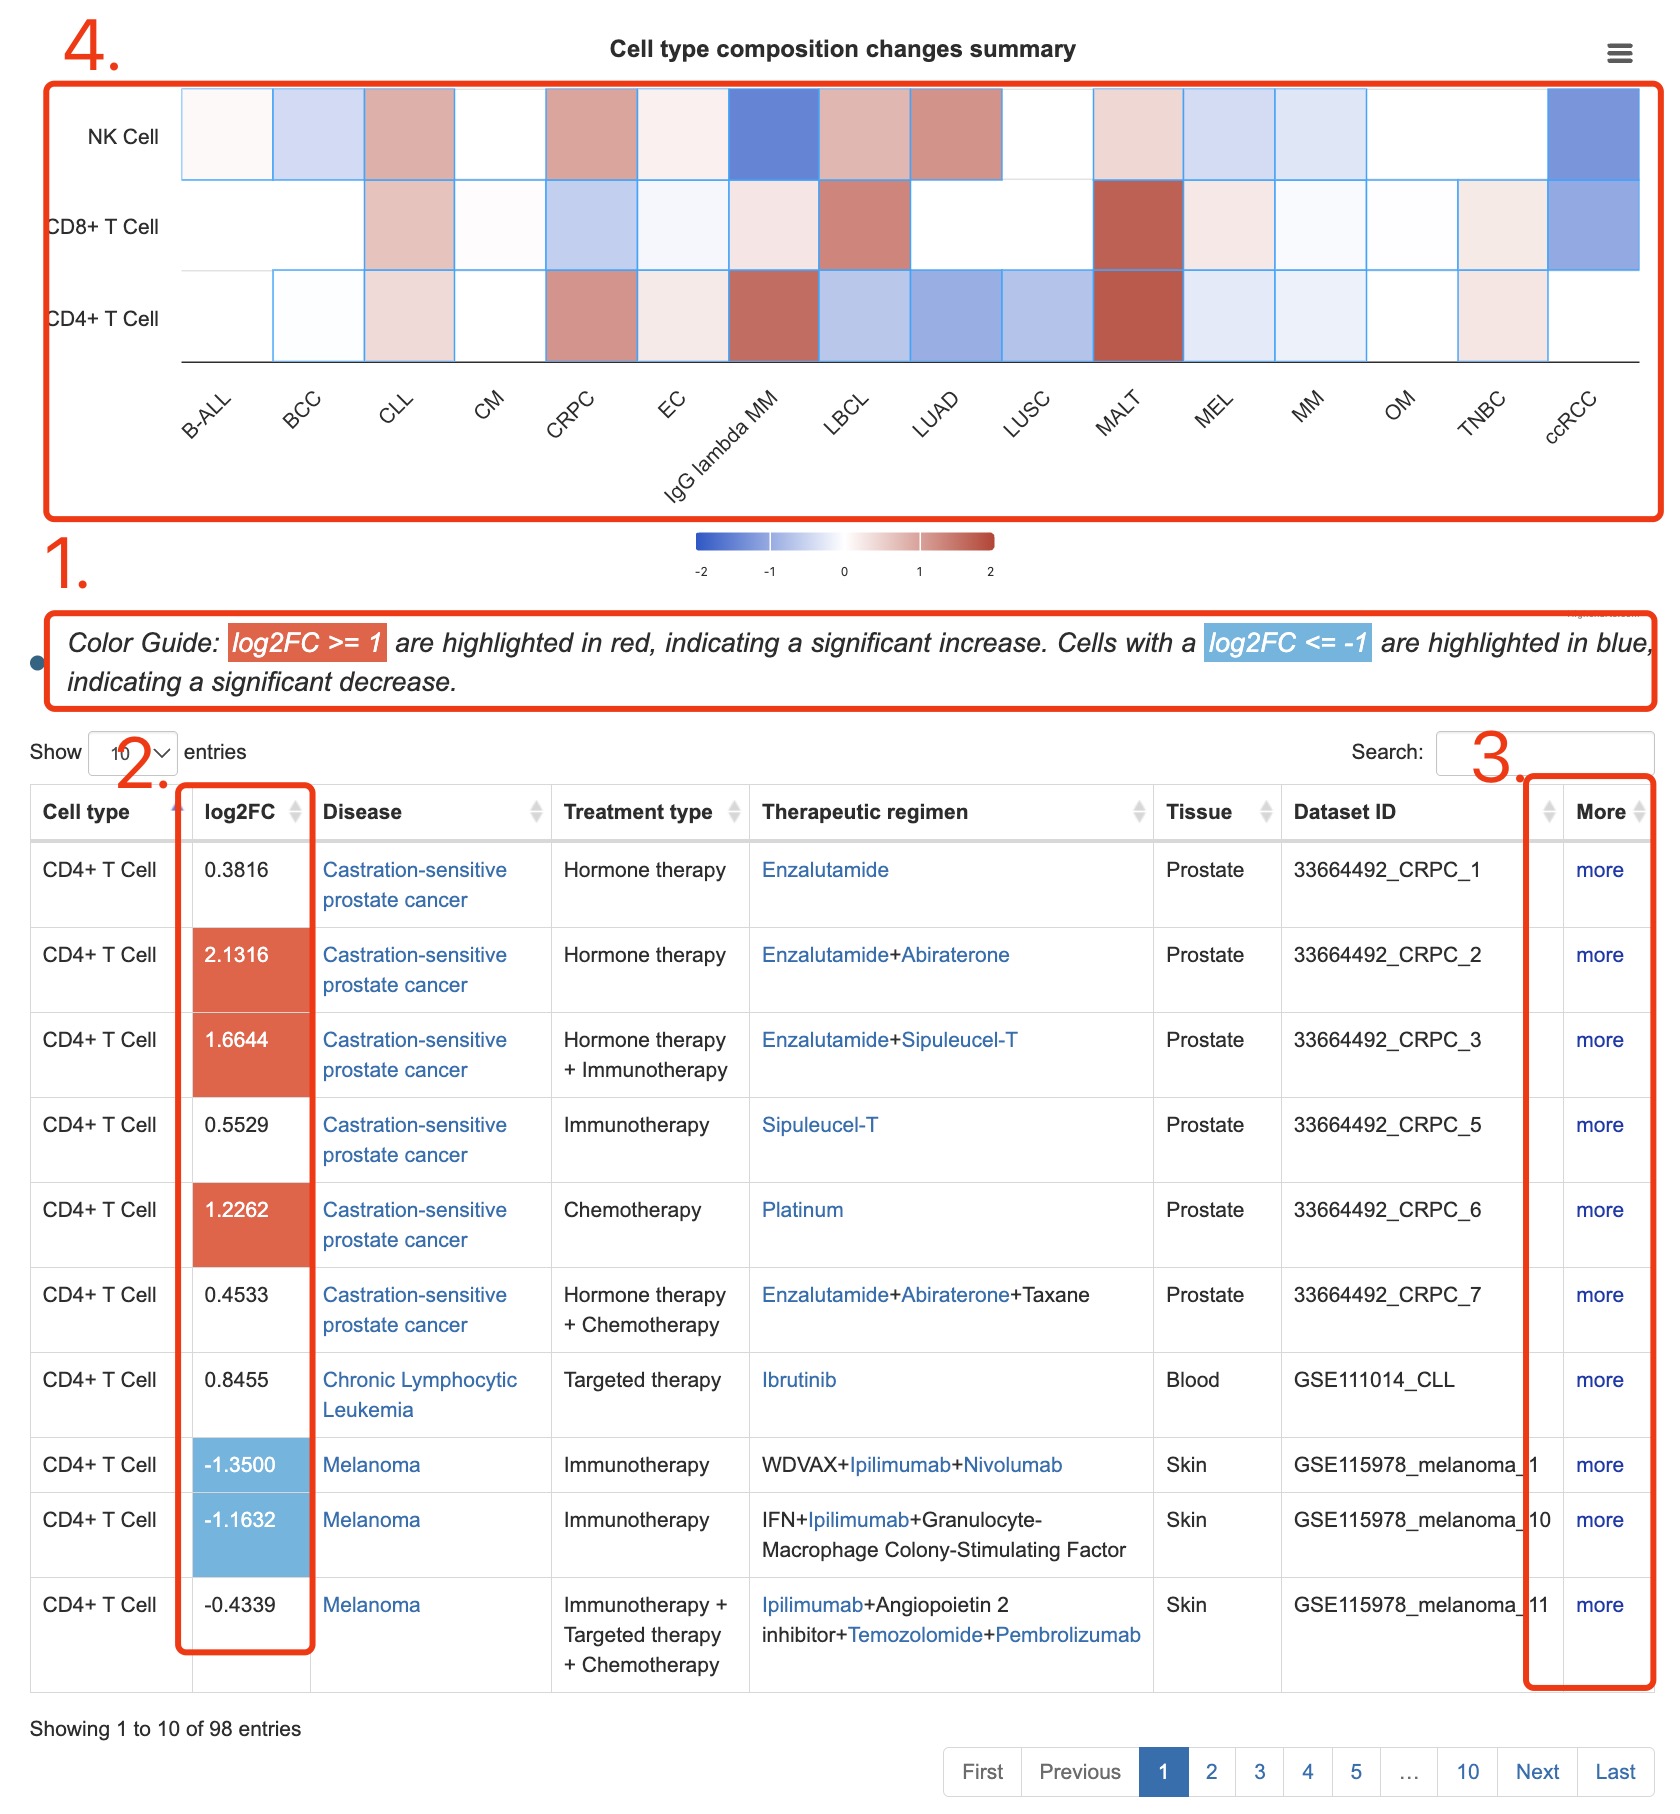
Fig 3-2. Result page of cell search
In the Detail page, you can get the detail information of the scRNAseq dataset including “Basic Information”, “Sample Information” and “Analysis Results”.
Fig 4-1, Basic Information:
1. Download Link: click to download the expression matrix and clinical data in RDS format.
2. Data Information: including Sample Size (number of samples included in the dataset), Cell Number (total count of cells analyzed) and Cancer Type (type of cancer studied in the dataset).
3. Treatment Information: including Therapy Type (categories of treatment applied), Therapeutic Regimen (specific drugs used in the treatment regimen, along with their combination) and Drug Information (name, drugbank ID and FDA approval of drugs).
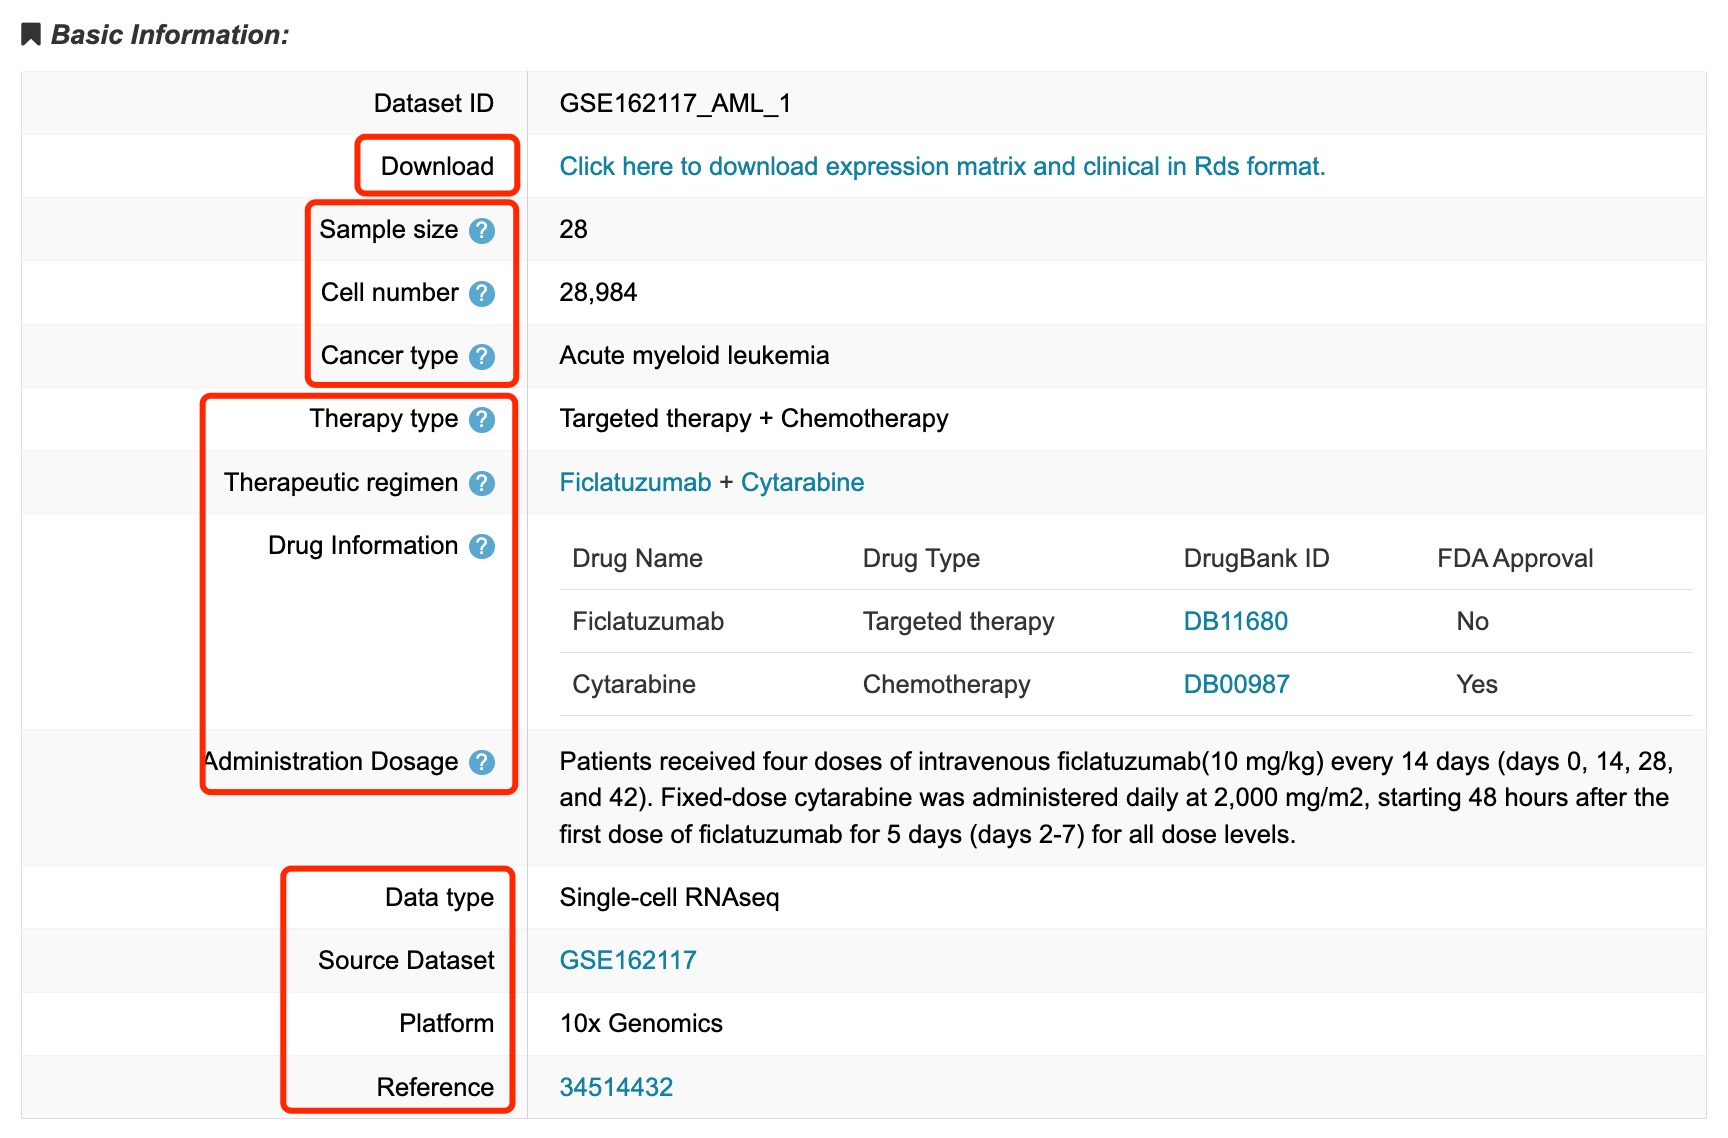
Fig 4-1. Basic information
Fig 4-2, Sample Information:
1. Detail information of samples included in the dataset.
2. The table contains sample ID, patient ID, sampling time, response, age, sex etc.
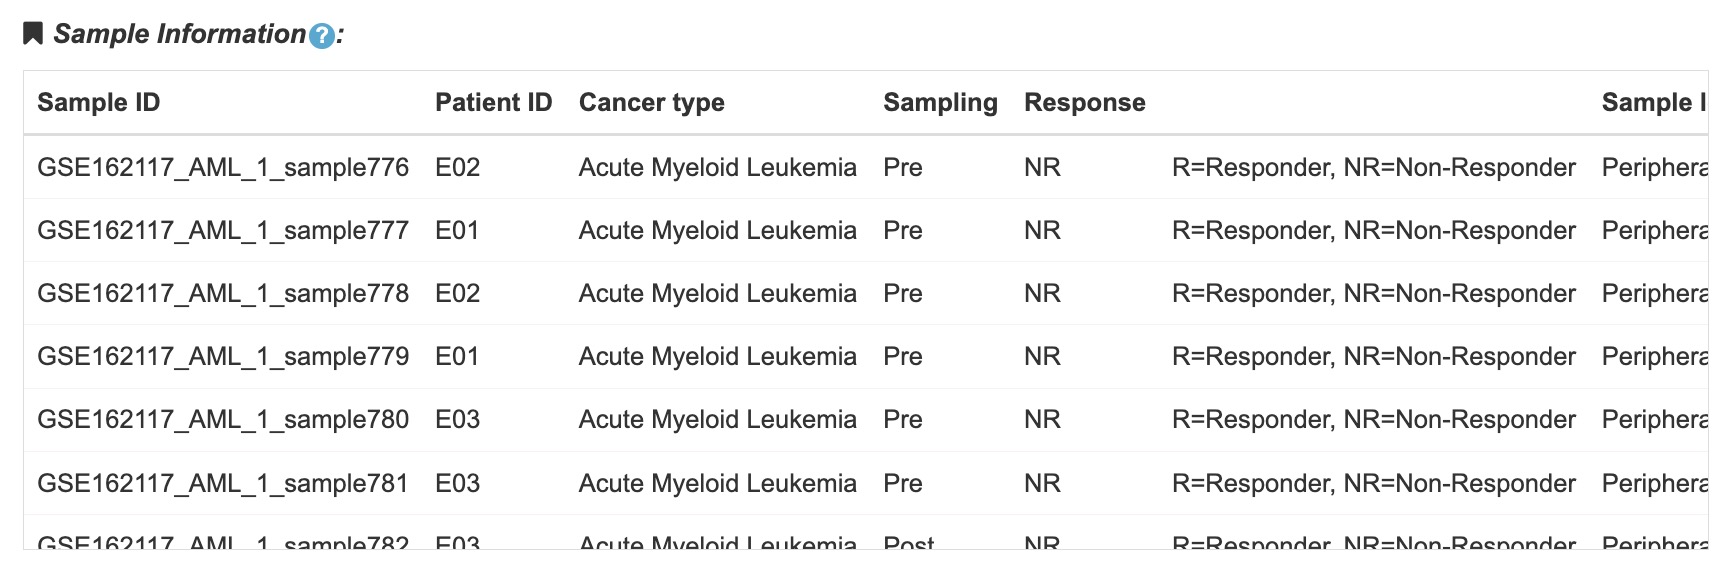
Fig 4-2. Sample information
Fig 4-3 to Fig 4-7, Analysis Results:
1. UMAP plots for the dataset, colored by cell types, patient samples and sampling time (pre or post of treatment).
2. Differentially expressed genes among cell types.
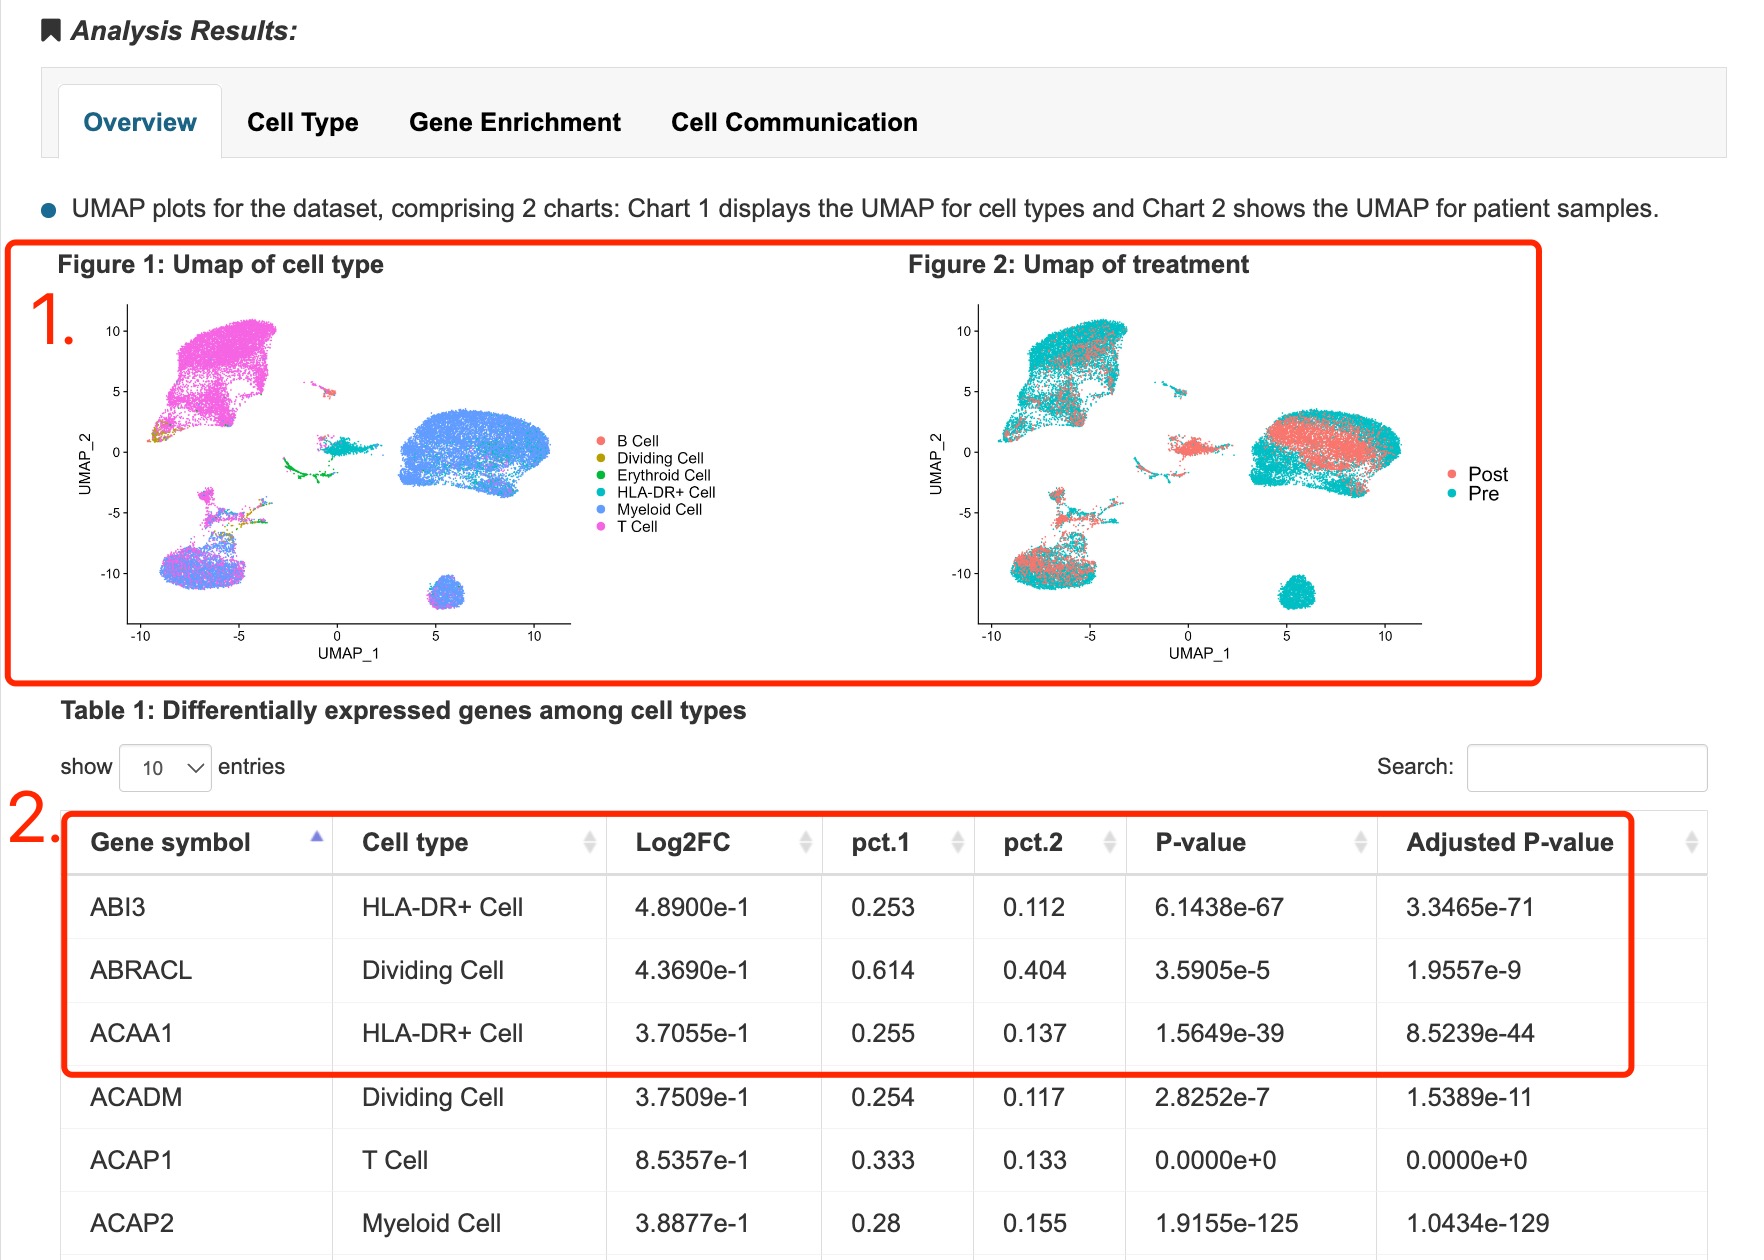
Fig 4-3. Overview of dataset
1. Stacked diagram of cell type composition across the different samples.
2. Table of cell type composition across the different samples.
3. The marker genes for cell type recorded in the research.
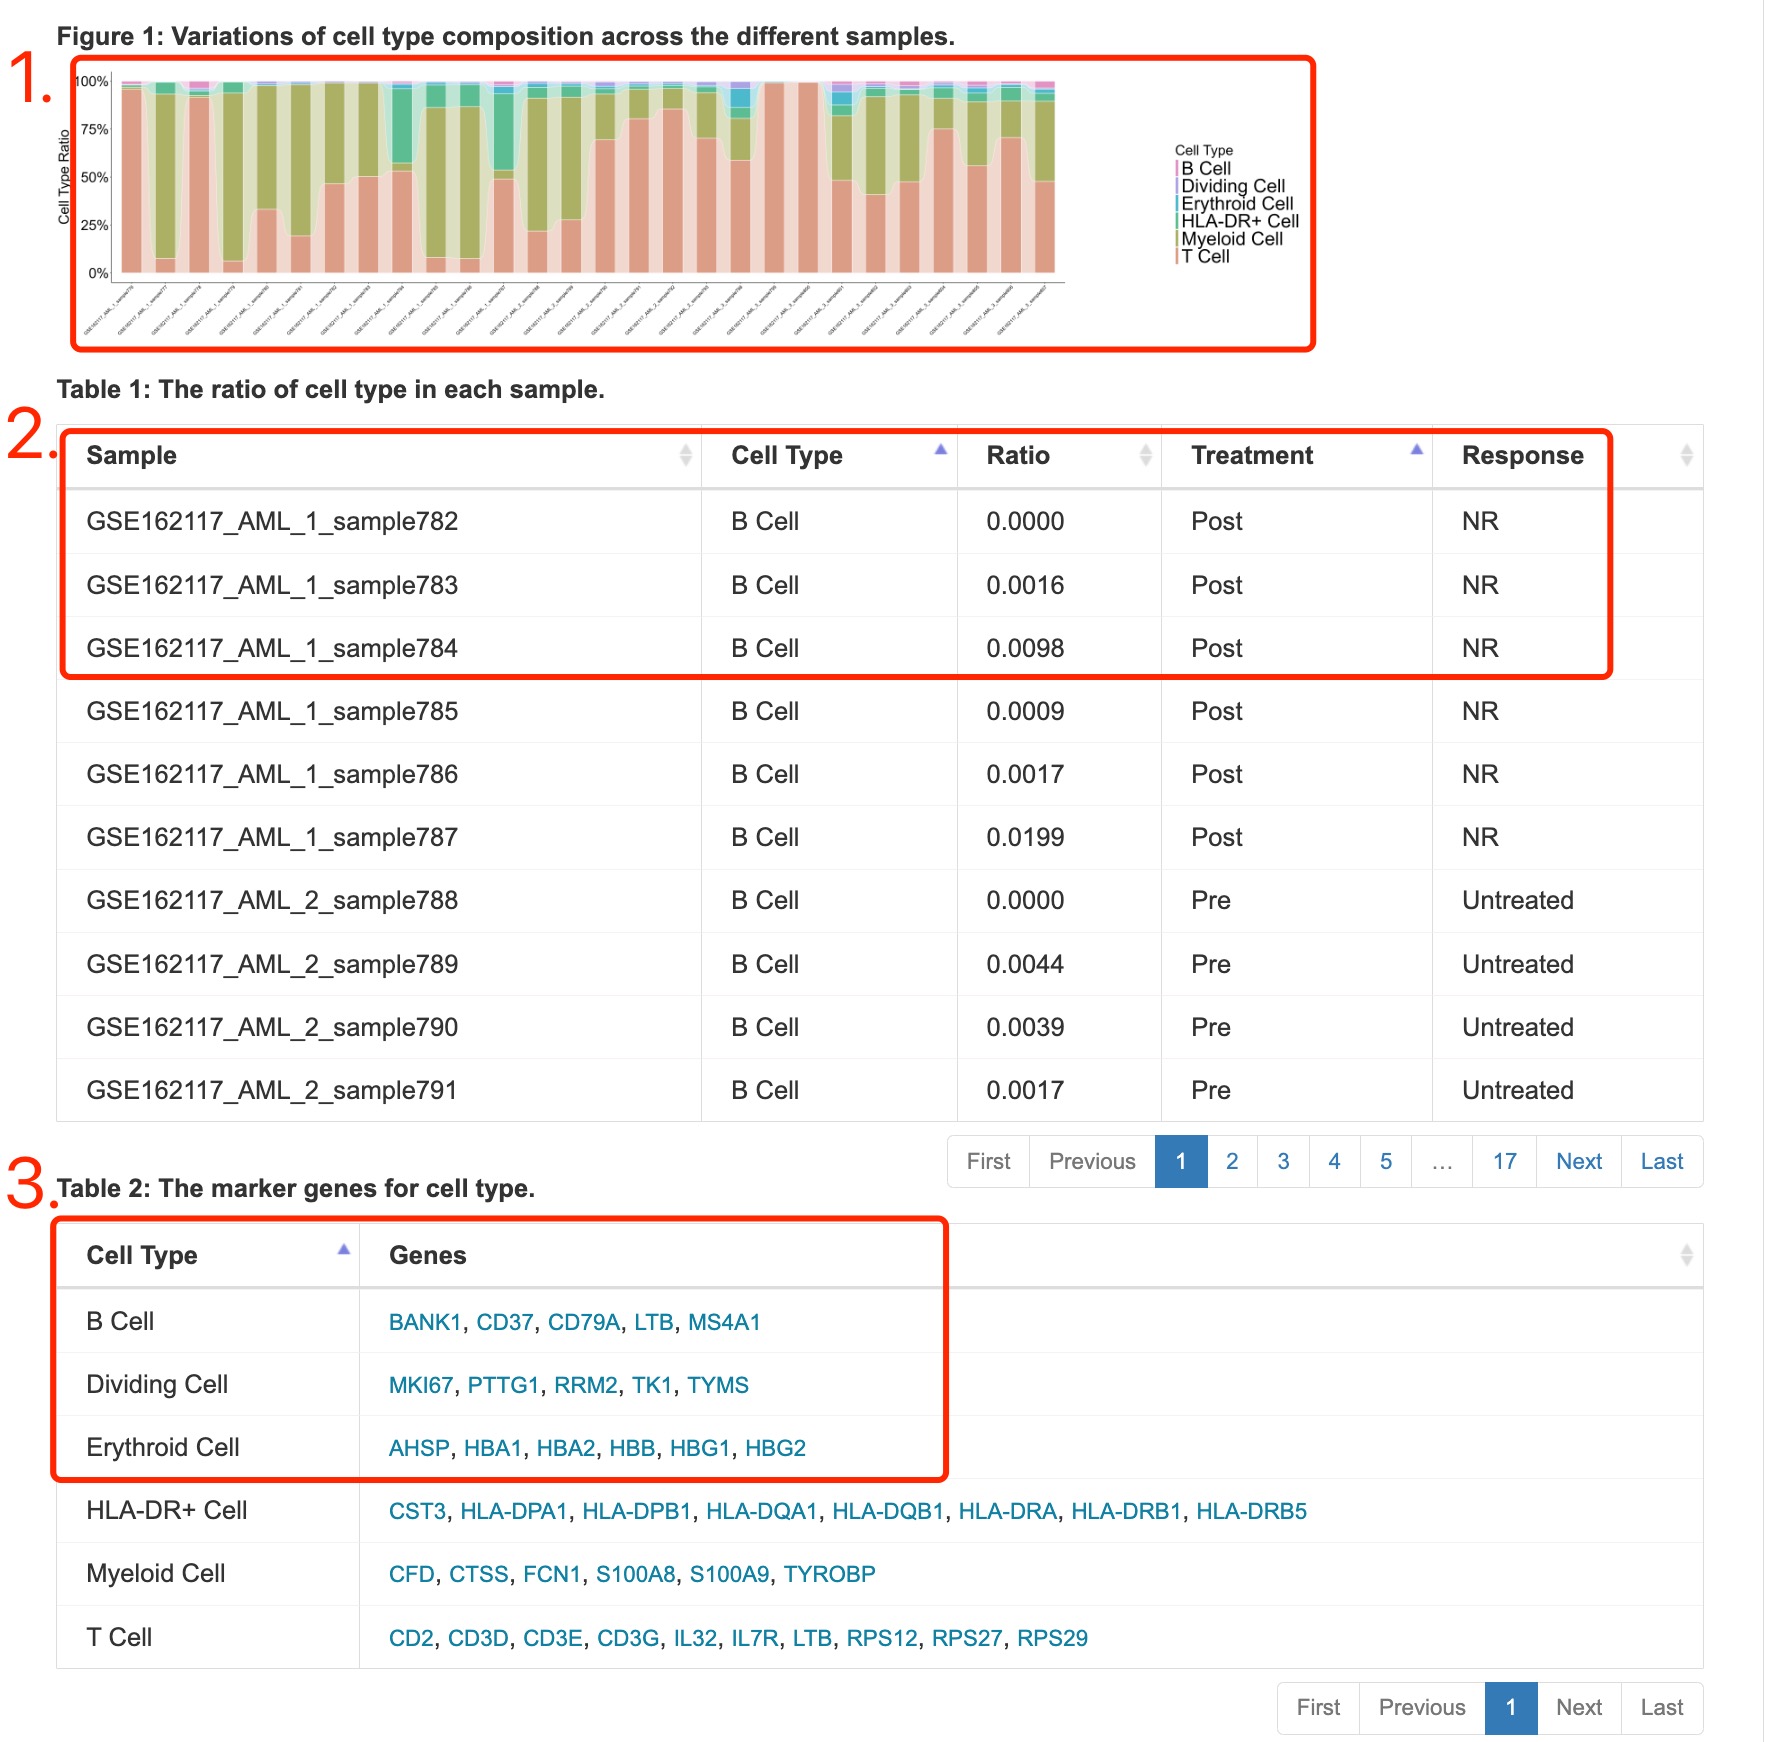
Fig 4-4. Cell type
1. GO enrichment of differentially expressed genes between different groups.
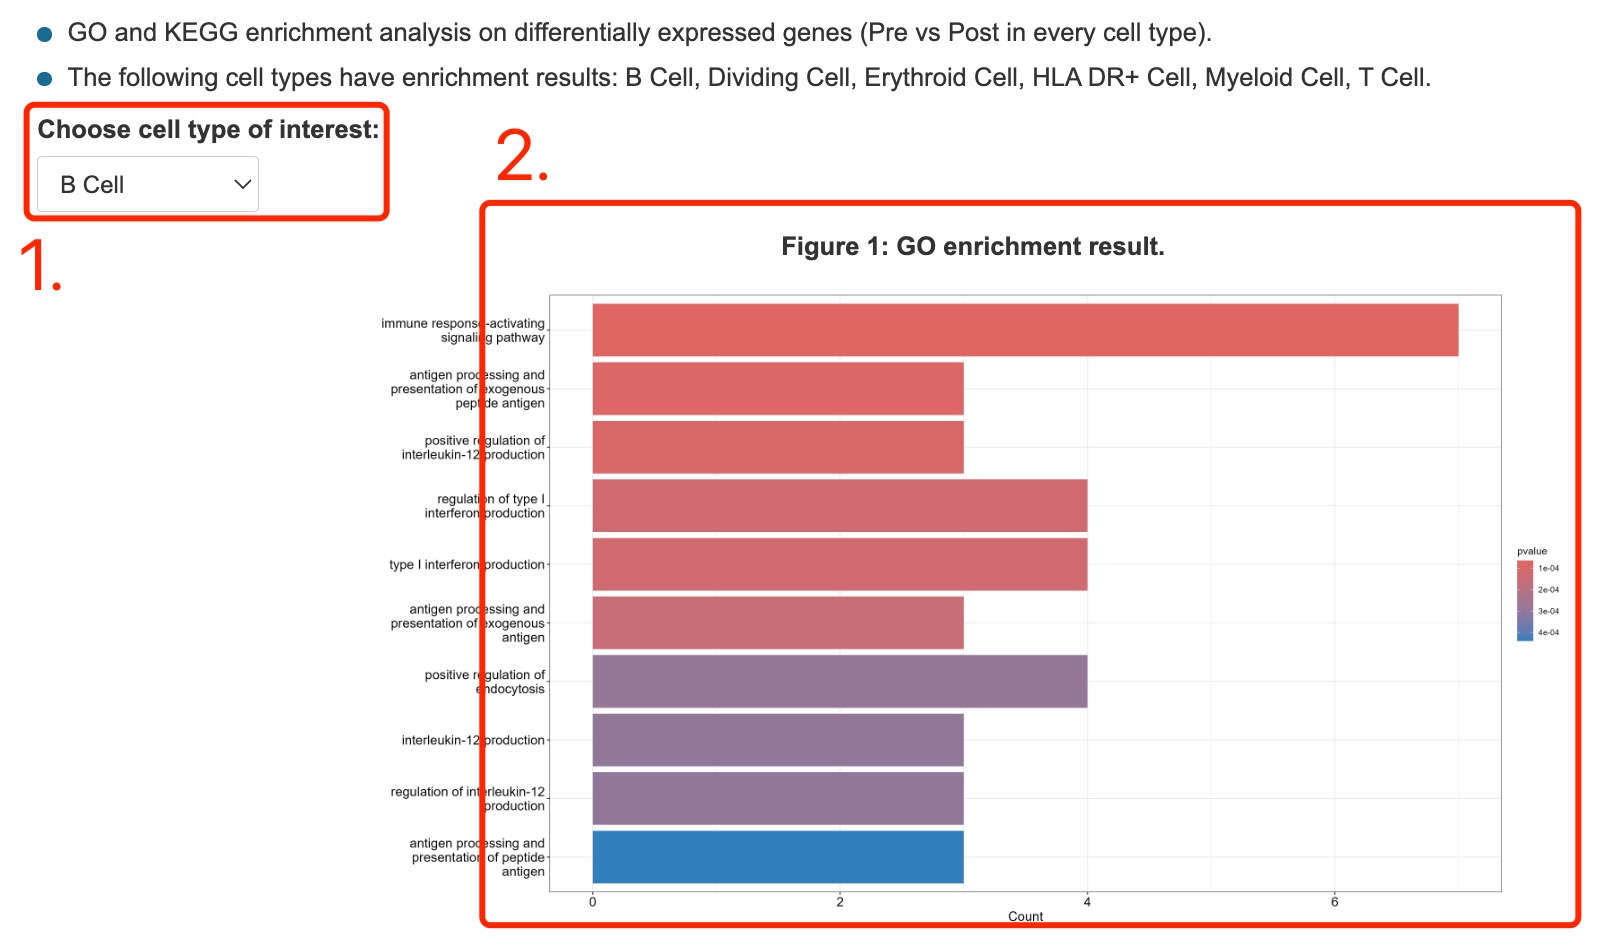
Fig 4-5. Gene enrichment
1. Regulatory communication originating from different cell types (sender cell types).
2. Overall heatmap of regulatory interactions among various cell types.
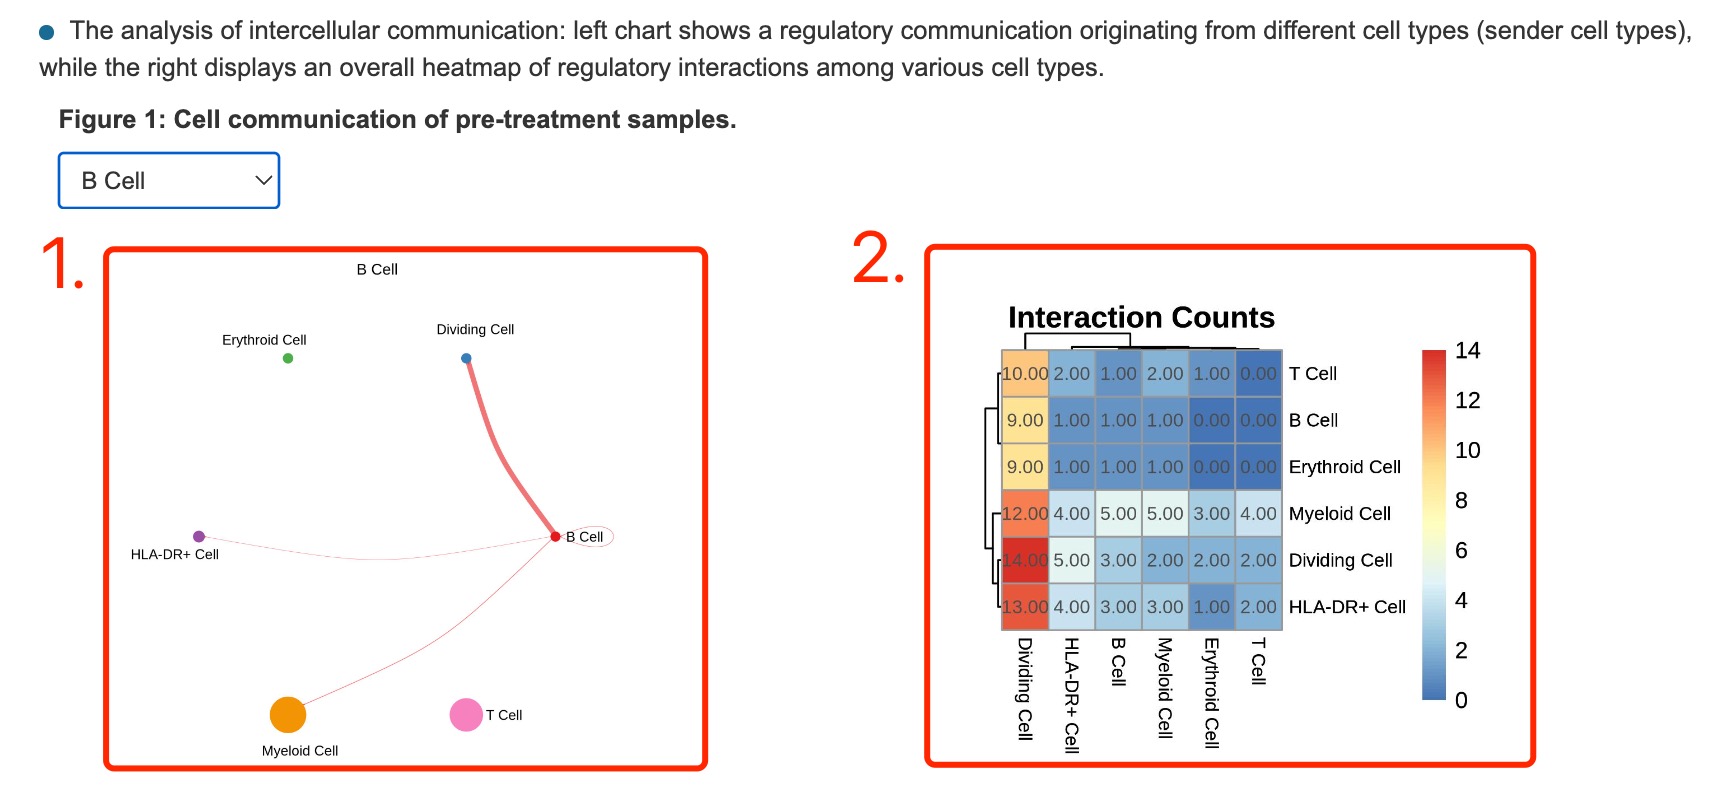
Fig 4-6. Cell communication
1. Click navigation of GSEA Enrichment to display gsea result.
2. Select option of specific cell type.
3. The activated and inhibited terms of Hallmark.
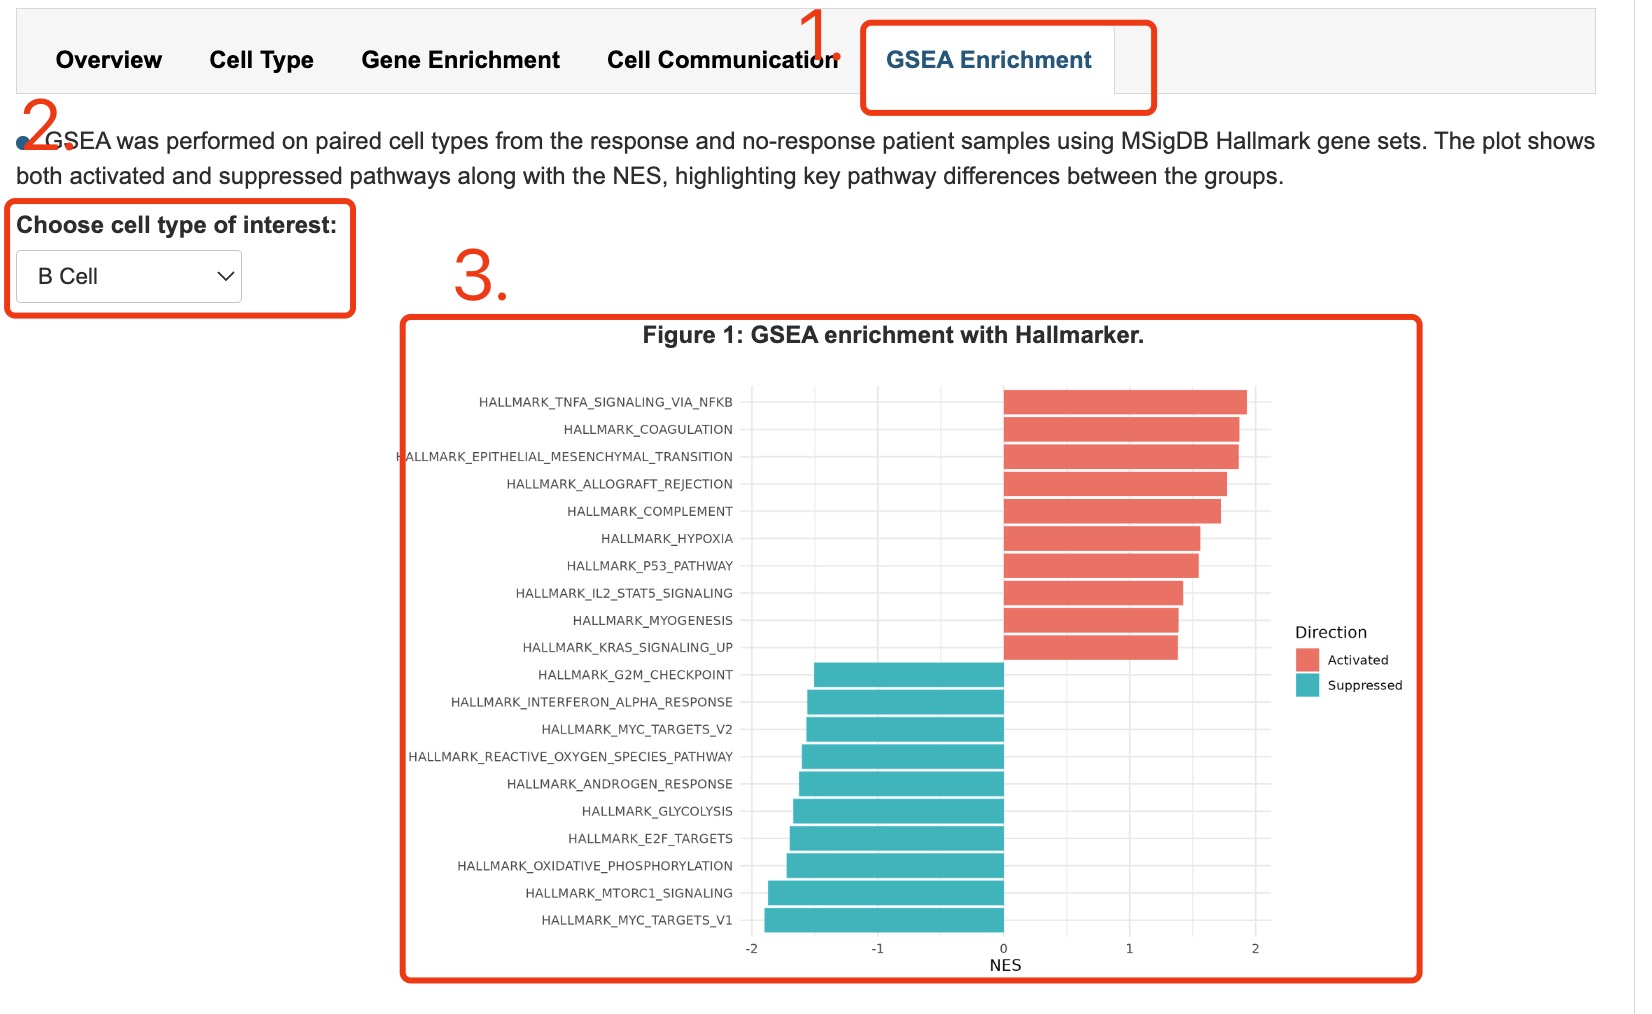
Fig 4-7. GSEA enrichment
The dataset and sample list was presented in the Browse page, Users can browse all the dataset.
Fig 5-1:
1. All datasets with basic information, including dataset ID, cancer type, treatment type etc.
2. Click the link to the detailed page of dataset.
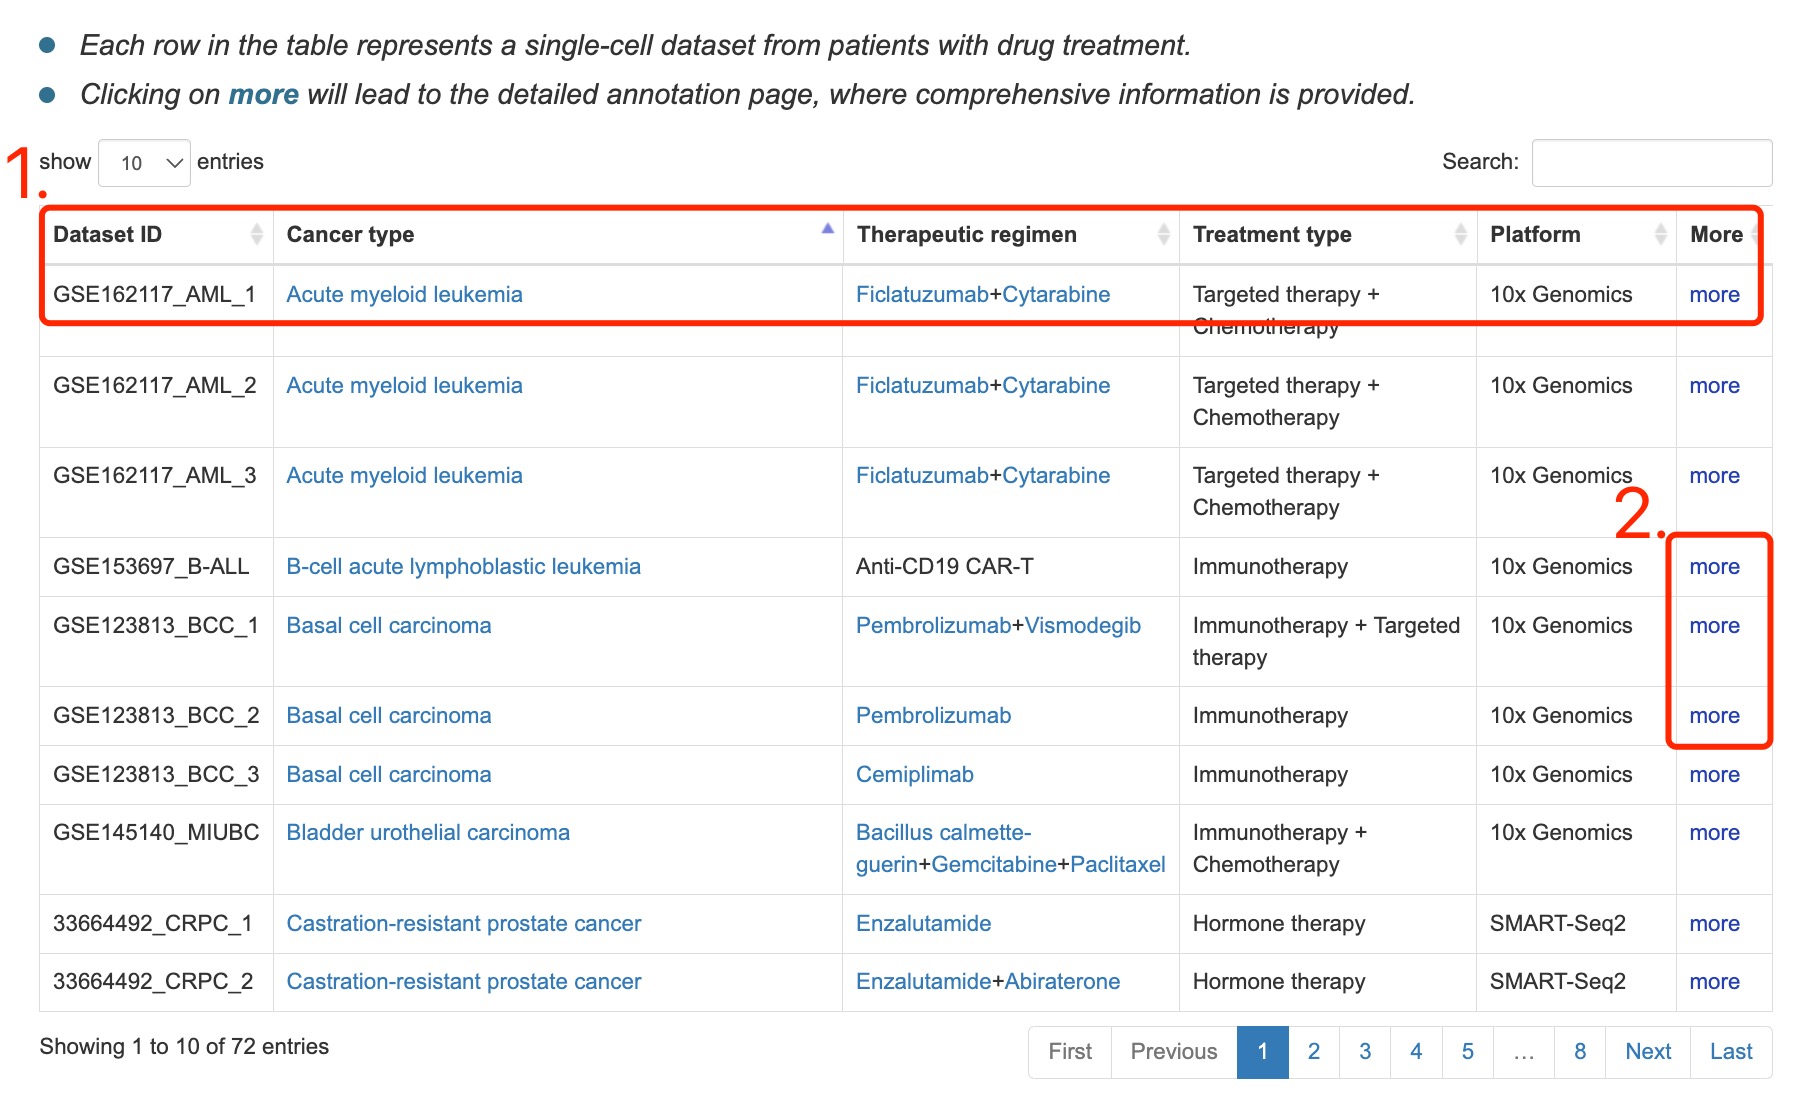
Fig 5-1. Browse page
CellResDB provide the download page for users. You can download all the expression and clinical data in the download page
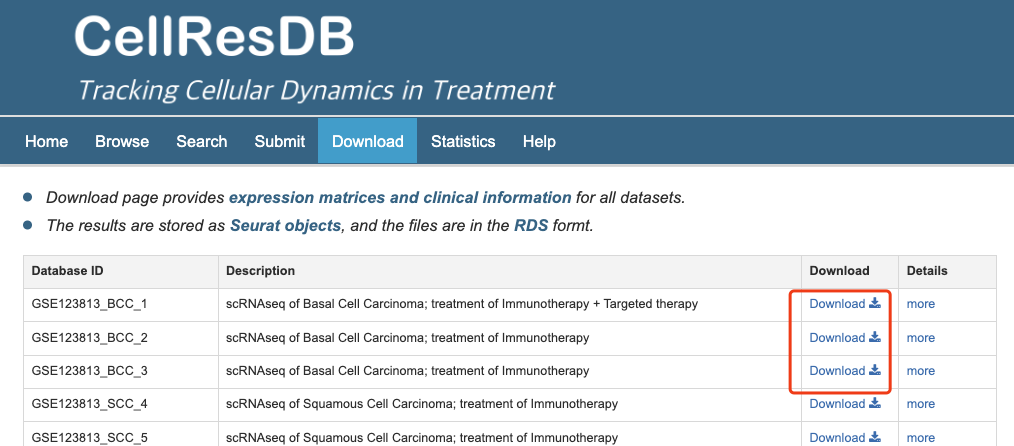
Fig 6-1. Download page
We developed an intelligent robot named CellResDB-Robot. This robot processes user input, which is in the form of natural language, and generates responses.
CellResDB-Robot is an experimental feature currently under active development. While we strive to ensure the accuracy and reliability of its responses, occasional errors may occur due to external API limitations or server updates.
- This tool is not intended for clinical decision-making or definitive data interpretation.
- If you encounter “Something went wrong, please retry”, please refresh the page or contact us at s2236013@s.tsukuba.ac.jp.
- This tool is not intended for clinical decision-making or definitive data interpretation.
Fig 7-1:
Users can find the robot icon on the CellResDB homepage.
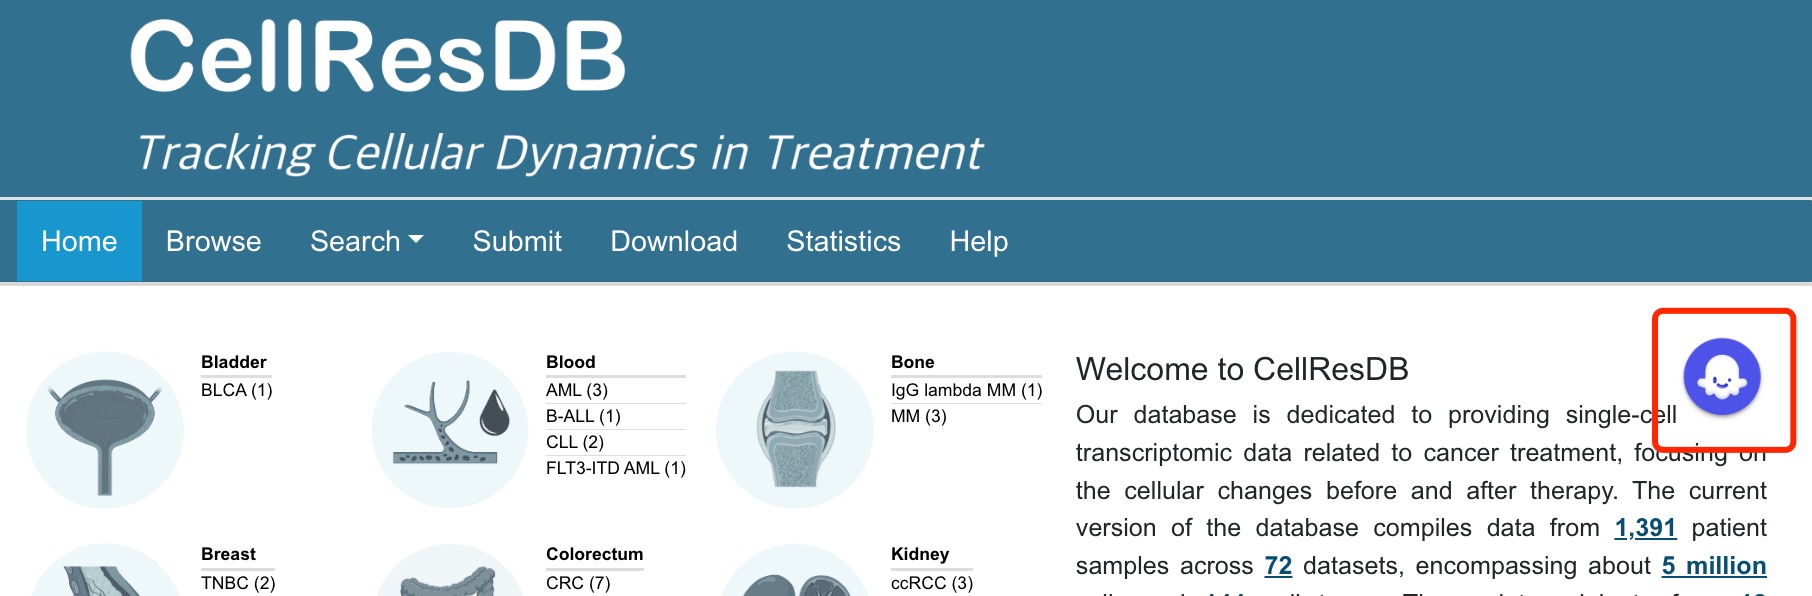
Fig 7-1. CellResDB-Robot in home page
Fig 7-2:
The robot icon is also available under the "Search" navigation tab.
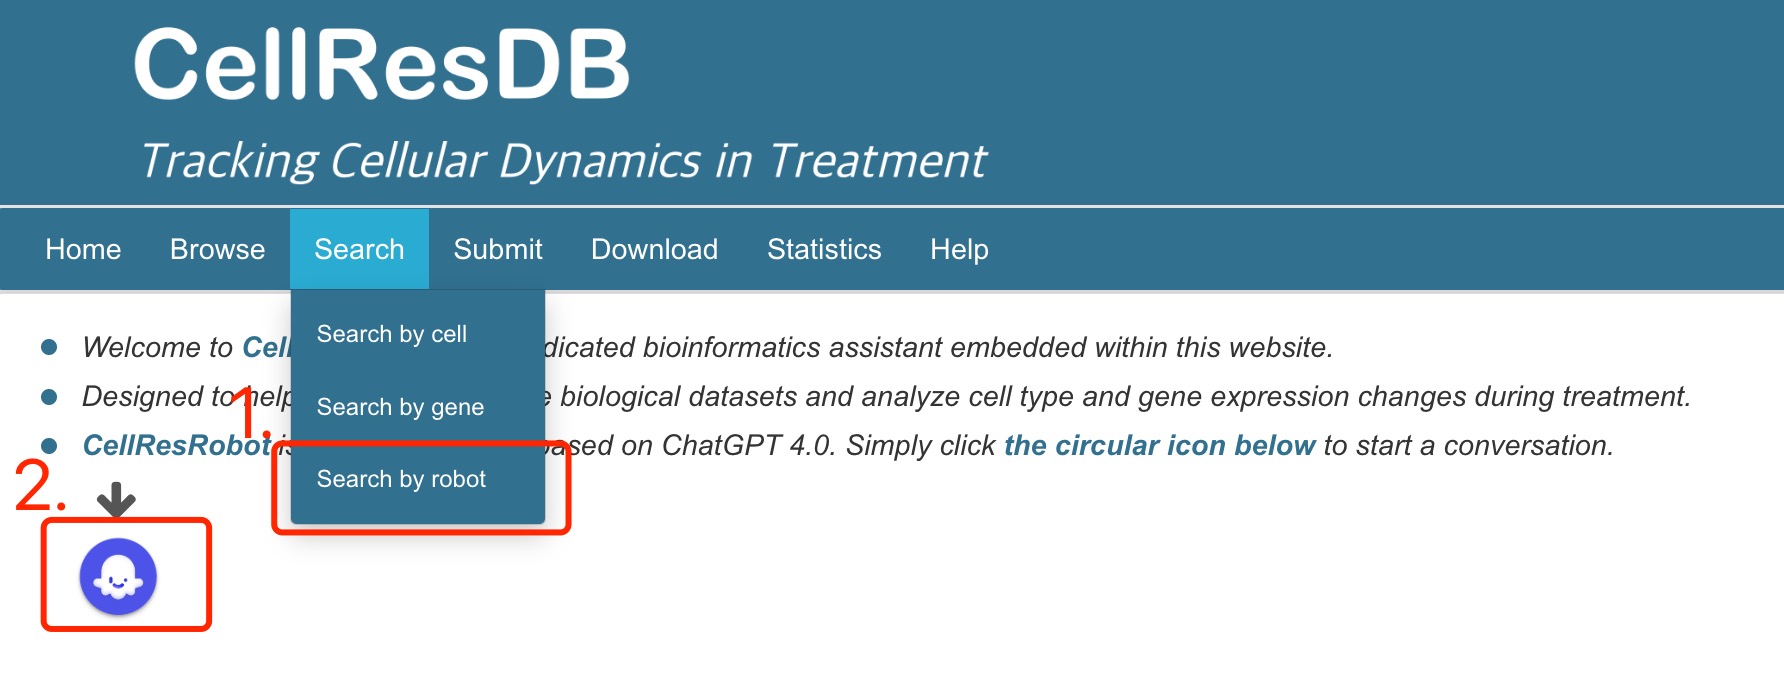
Fig 7-2. CellResDB-Robot in navigation tab
Fig 7-3:
After clicking the robot icon, a chatbot window will pop up, allowing users to engage in a Q&A dialogue through this plugin.
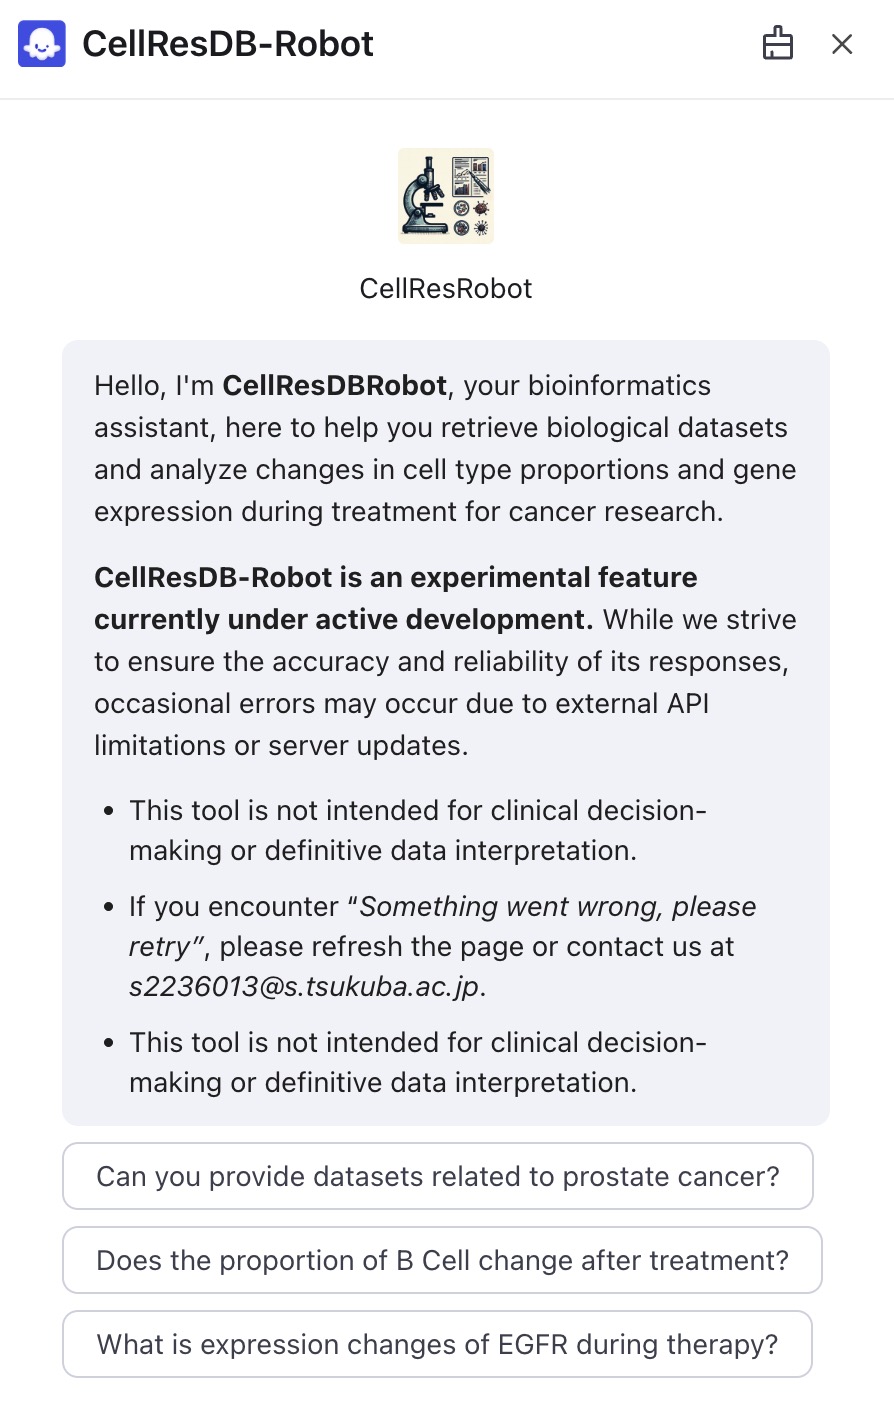
Fig 7-3. The chatbot window of CellResDB-Robot
Task 1: Retrieve datasets by cancer type
Purpose: Find datasets for a specific cancer type.
How it works: The robot extracts disease names from your input and matches them against the dataset registry.
Best practice: Clearly mention the cancer name in your prompt (e.g., “prostate cancer”).
Prompt example: I need datasets related to prostate cancer.
Task 2: Find cell type proportion changes after treatment
Purpose: Ask whether a cell type increases or decreases after treatment.
How it works: The robot identifies the cell type and optionally a cancer context, then searches the cell proportion change table.
Best practice: Name one specific cell type (e.g., “macrophages”).
Prompt example: Does the proportion of B cells change after treatment?
Task 3: Explore gene expression dynamics
Purpose: Check treatment-induced expression changes of specific genes.
How it works: The robot extracts the gene name and looks up average log2 fold change values in the gene expression table.
Best practice: Specify the gene symbol (e.g., “EGFR”).
Prompt example: What is the expression change of EGFR during therapy?